Participant recruitment methods: 5 ways to find people
Participant recruitment methods compared by who you need: your own list, panels, referrals, networks and recruiters, plus a check before you set a date.
Voice of customer analytics shows what moved in feedback, not why. Read it without being misled and pick the signals worth a follow-up conversation.
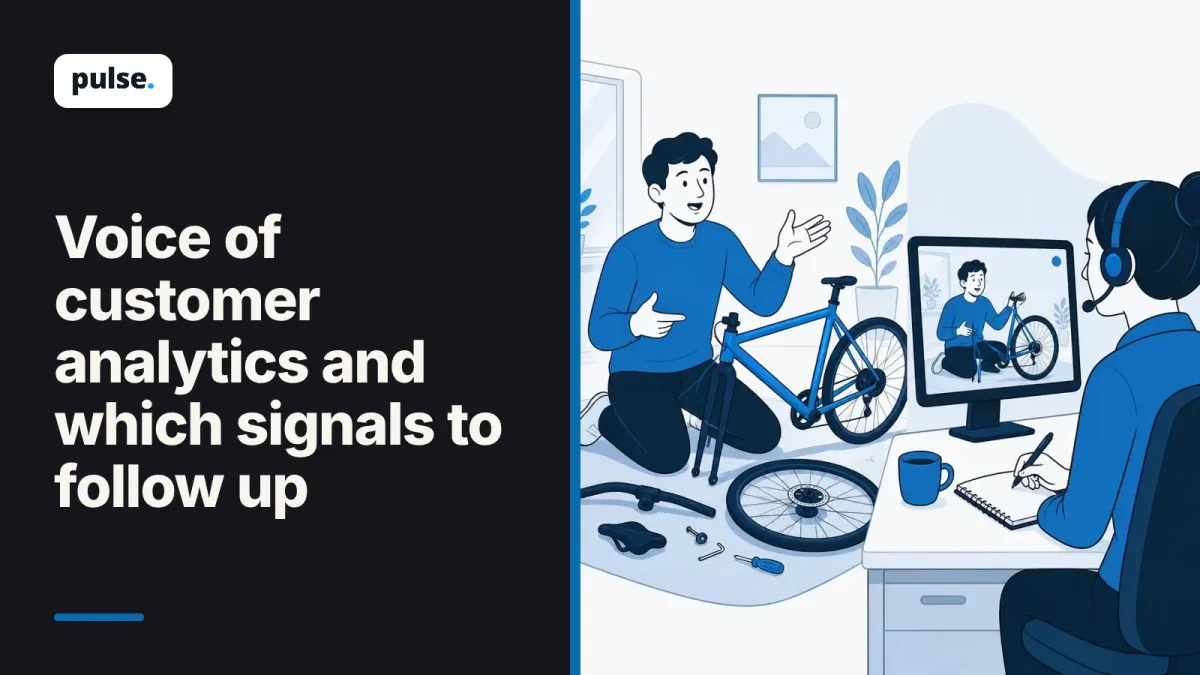
The feedback dashboard at the online bike shop where you work flags something new every Monday. This week, complaints tagged "delivery" are up, and the mood score on "assembly" has dropped. You can't chase both this week. So which one do you look into?
That dashboard is voice of customer analytics: software that sorts customer feedback by topic and mood, so you can see what is moving.
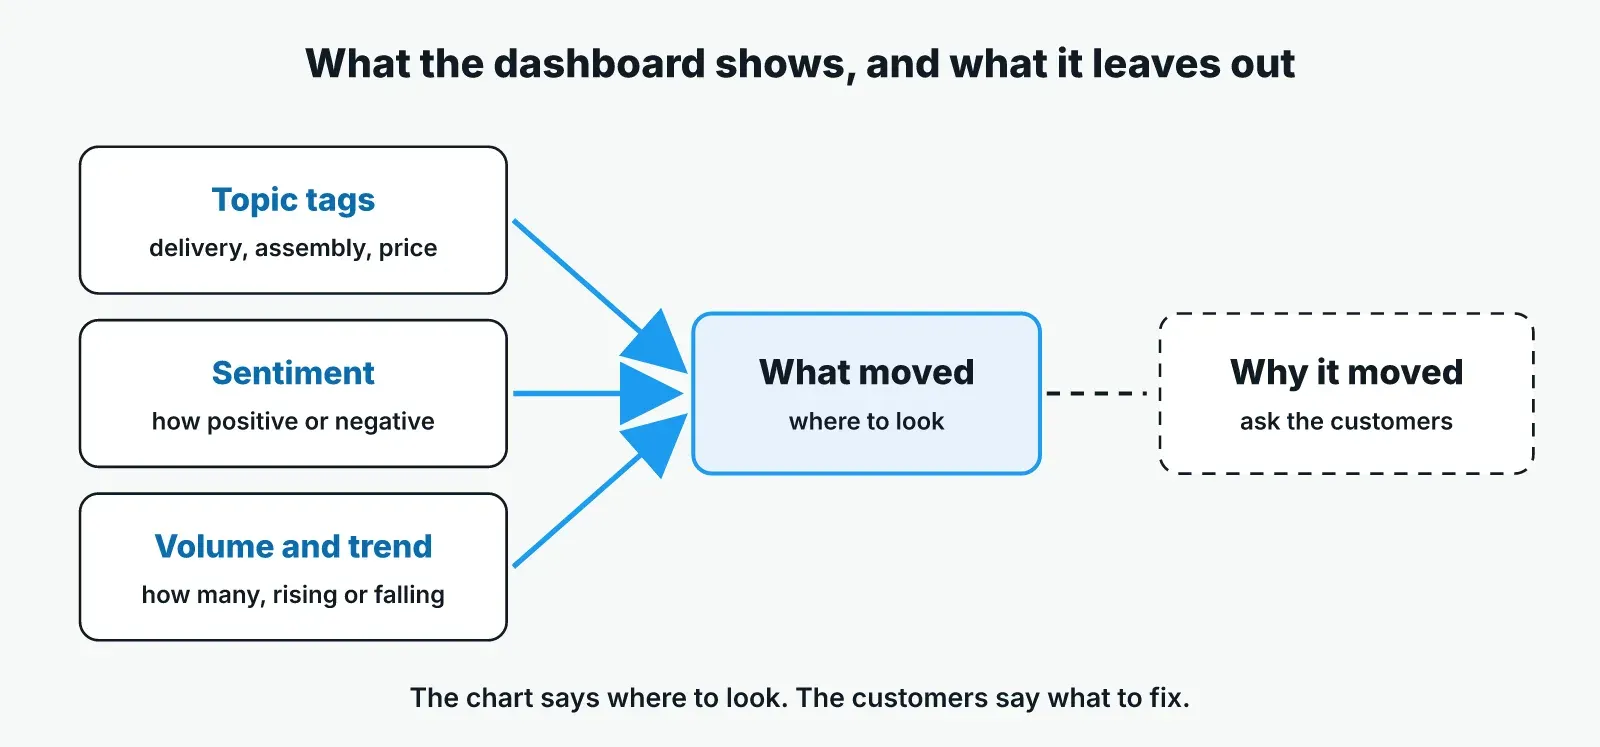
It tells you what moved, and it can't tell you why. So follow up on a signal when it is growing, touches the customers who matter most to the business, and has a reason you can't already explain. Then ask those customers directly.
Four questions sort the alerts worth chasing from the noise.
Your team trusts the dashboard because it looks precise, with neat charts and exact counts. It helps to know what sits under those charts. Most voice of customer analytics tools turn comments into three outputs: topic tags, sentiment scores, and volume over time. Each one answers a narrow question, and none of them answers why.
The software reads each comment and files it under a theme, such as delivery, assembly or price. At the bike shop, "the box arrived torn" goes under delivery, and "I couldn't fit the pedals" goes under assembly.
Sentiment is a score for mood: how positive or negative a comment sounds. Tools give it to each comment, then average it for each topic.
This is how many comments land in each topic, and whether that number is rising or falling week by week.
These tools are changing shape, too. In December 2025, Forrester announced it was combining its separate coverage of customer feedback management and text analytics into one category, because the lines between those tools have blurred. And in Forrester's Q3 2025 evaluation of 10 digital analytics vendors, the analysts found that no single vendor fully addresses every use case, with voice of the customer listed among the uses that market now covers. So whichever tool your company runs, expect it to show part of the picture.
The charts are accurate about what they count. The trouble starts when a team reads a count as a cause or a priority. Three traps come up again and again, and each one can send the bike shop's team after the wrong fix.
"Delivery" gets the most mentions because every order has a delivery. A rarer complaint, such as a frame that cracked within a month, may cost the business far more in refunds and lost trust. A high count tells you a topic is common, and nothing more.
"Great, another late delivery" can score as positive, because the tool sees the word "great". A one-word comment like "fine" carries almost no mood at all. Treat a sentiment drop as a reason to read the comments, and save the verdict for after.
Customers who leave feedback are a particular group. Many customers who quietly stop buying never leave a comment, so their reasons never reach the chart.
Say the assembly score drops after the company switches to a new parts supplier. The team blames the supplier and changes back. But the real issue is new instructions that skip a step for the handlebars, and the score stays low.
The chart said where to look. It couldn't say what to fix, which is why the difference between what surveys and voice interviews each tell you matters here.
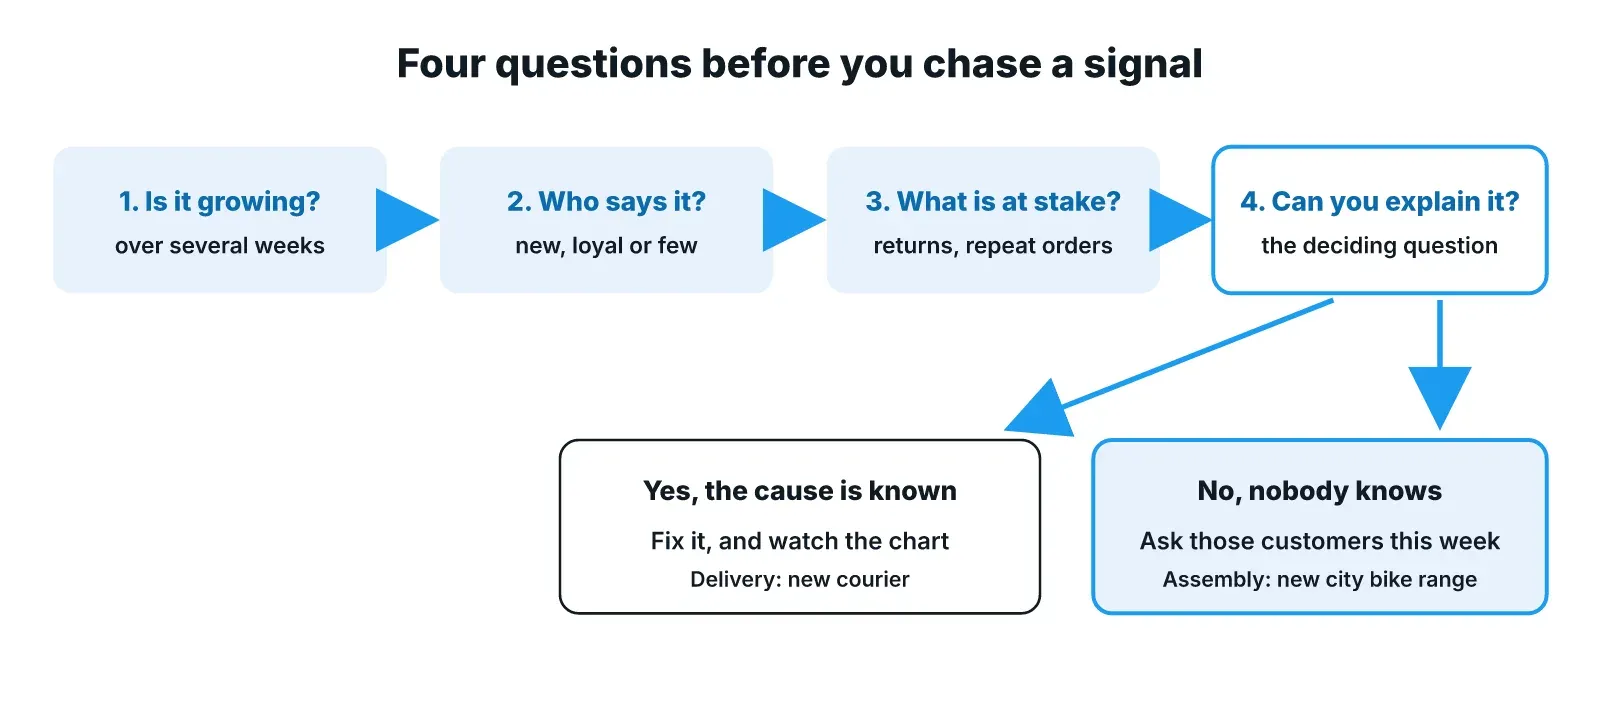
When two alerts compete for one week, you need a quick way to pick. Four questions do most of the work: is it growing, who is saying it, what is at stake, and can you already explain it. A signal that is growing, comes from customers who matter, and has no known cause deserves a conversation.
Look across several weeks before you decide. A topic that bounces up and down is often noise.
Check whether the comments come from new buyers, loyal ones or a small group with one shared problem.
Think about refunds, repeat orders and public reviews. A small signal with a big cost can beat a big signal with a small one.
If you know the cause, you don't need research to fix it. If nobody knows, that's the signal to follow up.
Here is how the bike shop's two alerts score.
| Question | Delivery signal | Assembly signal |
|---|---|---|
| Is it growing? | High but steady for several weeks | Smaller, rising each week |
| Who is saying it? | All kinds of buyers | First-time buyers of the new city bike range |
| What is at stake? | Some unhappy reviews | Returns of whole bikes, and first-time buyers who may not come back |
| Can you explain why? | Yes: a known switch to a new courier | No |
| Verdict | Fix with the courier, keep watching | Follow up with customers this week |
Chase the signal you can't explain, even when it isn't the loudest one.
Once you've picked a signal, the goal is to hear the reason from the customers behind it, quickly enough to act. A week is enough for a focused follow-up if the team agrees, before it starts, what result would change a decision. Here is one way the bike shop's team could run it.
In a large company, decide who owns the follow-up before the alert lands. Customer experience, product and the research team may all see the same chart, and a signal nobody owns tends to sit.
If you want to run this as a standing routine, see how a standing voice of customer program works when it runs on conversations. When the week is done, you can write up what you found so the people deciding act on it. And for clicks and drop-off data, the same idea applies when pairing behavior data with interviews.
The bike shop's team knows assembly complaints are rising among first-time buyers of the new range. What it needs is their reasons, this week, in their own words. That follow-up conversation is the step Pulse runs as AI-moderated voice interviews.
Customers take the interview by opening a link on a phone or laptop, so there are no calls to schedule. The AI moderator's follow-ups build on what each customer said earlier, and a vague answer gets a second question. You can invite the exact customers behind the signal from an uploaded list, or straight from your customer database through a connector.
Pulse groups the answers into themes with the quotes behind each, and every quote links to its transcript. The report builds as interviews finish, ready minutes after the last one. Then trackers repeat the same questions wave after wave, so you can see whether the fix moved things against the first study.
The analytics tool spots the signal, the interviews find the reason, and your team decides the fix. You can start with a free trial and a free study, or book a demo to follow up on one of your own alerts.
Voice of customer analytics is software that gathers customer feedback, such as reviews, survey comments and support tickets, and sorts it by topic and mood. It shows which topics are growing and how people feel about them. It's a fast way to spot change, and it works best paired with conversations that explain the change.
Sentiment scores are easier to trust on longer comments, where there's more to go on. Sarcasm, mixed feelings and one-word replies are hard for software to score. Use sentiment trends to decide which comments to read, then read them, and check a sample by hand before a decision rests on the score.
Talk to a small group of customers who left, soon after they leave. Ask them to walk you through the last few weeks before they cancelled, and ask a second question whenever an answer is vague. Then use a short survey to check how common each reason is among everyone who left.
A voice of the customer system is the set of tools and habits a company uses to collect feedback, spot what is changing and act on it. It usually includes surveys, review and ticket analysis, and a way to follow up with customers directly. The follow-up step is what turns a chart into a reason.
Participant recruitment methods compared by who you need: your own list, panels, referrals, networks and recruiters, plus a check before you set a date.
Semantic vs latent themes, from Braun and Clarke's paper "Using thematic analysis in psychology", shown on real-life quotes, with when to use each.
How to choose a transcription service for research interviews: test each option on your own audio with five simple checks, from accuracy to data safety.