Surveys tell you WHAT, voice interviews tell you WHY: the question your NPS score can't answer
NPS scores show sentiment shifts but hide operational causes. Learn how conversational voice interviews diagnose the friction behind your survey ratings.
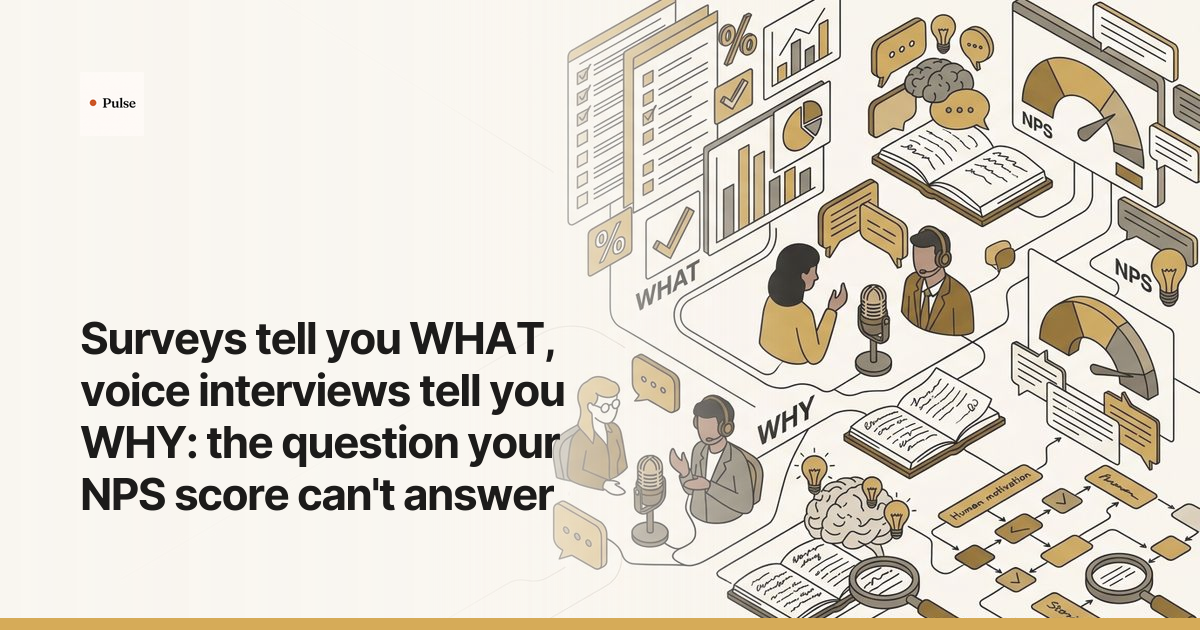
Quantitative customer surveys show that a metric shifted, but direct voice interviews reveal the operational friction that caused the shift. Net Promoter Scores track directional sentiment across accounts, yet an 11-point scale cannot articulate why users disengage. By pairing survey trackers with spoken follow-ups, research teams diagnose the root causes behind score drops before renewal risk damages retention.
Why NPS Scores Show the Metric but Hide the Mechanism
Net Promoter Scores aggregate point-in-time sentiment into an index, but they cannot explain the business friction, workflow breakdowns, or procurement shifts driving those ratings. Numerical scores register that customer perception changed while discarding the operational context required to diagnose the issue, leaving product and customer success teams guessing at root causes.
When Fred Reichheld introduced the Net Promoter metric in 2003, he asserted that likelihood to recommend was the single most reliable indicator of company growth. Later disclosures by Satmetrix in 2004 revealed that this finding relied on roughly 50 companies across 12 industries and paired survey scores with backward-looking historical revenue growth rather than predicting forward performance. Subsequent empirical research, including a longitudinal examination by Keiningham and colleagues published in the Journal of Marketing, demonstrated that Net Promoter Scores do not outperform standard satisfaction metrics or reliably predict firm-level revenue growth.
This predictive gap occurs because an aggregate score obscures three critical operational dynamics:
- Lagging score collapse: In a 2014 study published in The TQM Journal, Kai Kristensen and Jacob Eskildsen demonstrated that collapsing an 11-point scale into Promoters (9 to 10), Passives (7 to 8), and Detractors (0 to 6) discards valuable statistical variance. The resulting metric amplifies volatility while masking whether a drop came from widespread mild discontent or acute failure in a single enterprise account.
- The comment box selection trap: To reduce drop-off, relationship surveys make open-ended text fields optional. CustomerGauge's benchmark data indicates that only about 44% of respondents who provide a numerical score choose to leave a comment in an optional text box. Adding mandatory text fields depresses completion rates further, increasing survey abandonment by 5% to 15% per required field.
- Polarized verbatims: Academic work by Nan Hu, Paul A. Pavlou, and Jie Jennifer Zhang on self-selection and under-reporting bias in voluntary feedback proves that voluntary responses follow an asymmetric, bimodal distribution. Customers with extreme experiences submit comments, while moderate users remain silent. The resulting text boxes deliver short, emotionally charged keywords such as "poor reporting" or "great account manager" without actionable diagnostic detail.
When leaders treat aggregated ratings as definitive answers, engineering roadmaps end up targeting visible surface complaints instead of resolving silent blockers that threaten account health.

Surveys vs Voice Interviews: Comparing Information Density and Depth
Surveys offer broad coverage, statistical trending, and low delivery costs, but they cannot clarify ambiguous terms or challenge baseline assumptions. Spoken voice interviews provide high information density, allowing researchers to explore non-verbal cues, interrogate conflicting statements, and uncover specific organizational workflows that structured response options systematically miss.
Standard questionnaires restrict responses to predetermined rating scales and static multiple-choice options. While this uniformity allows automated dashboard aggregation across thousands of accounts, it prevents researchers from asking follow-up questions when a customer provides an unexpected evaluation. A respondent who marks a "6" on platform reliability might be responding to infrastructure downtime, confusing permission configurations, or a slow approval process within their own finance department. The survey captures the negative sentiment but leaves the underlying driver undefined.
Spoken customer conversations operate through dynamic laddering. When a customer mentions that an administrative dashboard feels slow, a researcher can immediately probe the operational context: What task were you attempting to finish? Which team members were waiting on the output? What workaround did your group use? This interactive questioning separates isolated interface grievances from systemic operational bottlenecks that trigger contract cancellations.
| Dimension | Quantitative Feedback Surveys | Qualitative Voice Interviews |
|---|---|---|
| Primary Output | Numerical ratings, benchmark trends, distribution metrics | Root causes, workflow context, mental models, trade-offs |
| Coverage Capability | Broad account distribution across large respondent pools | Targeted deep dives into strategic customer cohorts |
| Response Fidelity | Low: truncated text boxes and standardized scale values | High: conversational nuance, vocal inflection, spontaneous detail |
| Verification Mechanism | None: ratings must be accepted as submitted | Immediate: researchers can clarify contradictions and ask probes |
| Diagnostic Timeliness | High surface speed, low diagnostic clarity | Fast diagnostic clarity into underlying operational issues |
| Behavioral Capture | Stated opinion at a single isolated moment | Step-by-step recall of actual past operational actions |
Surveys indicate where attention is needed across an entire customer base. Spoken interviews explain what must change within specific workflows to resolve customer friction.

The Intention-Behavior Gap: What Closed Scales Miss About Buyer Decisions
The intention-behavior gap represents the statistical divergence between what customers claim they will do on a survey scale and how they act at contract renewal. Closed numeric ratings capture point-in-time customer sentiment but cannot measure buying committee dynamics, procurement requirements, corporate budget cuts, or internal organizational priorities.
In an extensive meta-analysis encompassing 422 empirical studies across 82,107 participants, behavioral researcher Paschal Sheeran demonstrated that stated intentions account for approximately 28% of the variance in downstream behavior ($R^2 \approx 0.28$). That leaves 72% of behavioral variance unexplained by intention scores alone. In enterprise software, this unexplained variance is populated by organizational realities: executive turnover, security compliance reviews, seat licensing audits, and competing internal initiatives.
These structural blind spots manifest in three distinct enterprise patterns:
- The buying committee disconnect: The individual completing an annual relationship survey is usually an operational end-user or line manager. Contract renewals and seat expansions are negotiated by finance directors, procurement departments, and executive buyers who rarely complete survey forms. A daily user rating a product 9 out of 10 cannot prevent a CFO from consolidating platforms.
- Forced loyalty vs true preference: In enterprise agreements with multi-year commitments, dissatisfied accounts (Detractors) do not churn immediately because contractual obligations and migration costs keep them locked in place. Conversely, satisfied accounts (Promoters) frequently terminate services during corporate restructuring or mergers.
- Non-linear repurchase dynamics: In an empirical study of 100,040 automotive buyers published in the Journal of Marketing Research, Vikas Mittal and Wagner A. Kamakura investigated the link between satisfaction and repurchase behavior. They found that while stated intentions exhibited diminishing returns as ratings climbed, actual repurchase behavior showed increasing returns. In certain segments, response bias caused stated ratings to show zero correlation with verified repurchase actions.
Furthermore, a retention study by de Haan, Verhoef, and Wiesel evaluated customer feedback across 93 firms in 18 industries and confirmed that standard top-box satisfaction metrics outpredicted Net Promoter Scores for customer retention. Closed survey scales measure an isolated individual's stated willingness to advocate. Direct conversations uncover whether the customer organization possesses the internal budget, operational sponsorship, and political will to keep using the product.

How to Run Conversational Follow-Ups to an NPS Survey in Practice
To turn survey anomalies into actionable operational findings, research teams must trigger targeted voice interviews within 48 hours of response collection. Prioritizing passive respondents (scores 7 to 8) and silent non-respondents alongside extreme detractors yields balanced, diagnostic evidence about systemic product performance and upcoming retention risks.
According to CustomerGauge's State of B2B Account Experience benchmark data, the average B2B NPS response rate across industries is 12.4%. Furthermore, in CustomerGauge's NPS Benchmark Report: Decade Edition (August 2026), an analysis of 340 B2B customer experience programs showed that 40% of programs record response rates of 10% or lower, while only 7% exceed a 50% response rate. When coupled with survey design benchmarks showing that only 44% of respondents provide written comments, an enterprise surveying 1,000 accounts receives roughly 55 open-text verbatims. This narrow yield represents barely 5.5% of the account base, skewed heavily toward vocal extremes.
1,000 accounts surveyed
       │
       ▼ (12.4% average response rate)
  124 numerical ratings
       │
       ▼ (44% text completion rate)
   55 open-text comments (5.5% net coverage)
Running an effective qualitative follow-up sequence requires four operational steps:
1. Identify high-risk response patterns
Filter survey data immediately for accounts displaying diagnostic anomalies:
- Enterprise accounts whose rating dropped by two or more points compared to the previous cycle.
- Accounts with high product usage that submitted a passive rating (7 or 8).
- Accounts where day-to-day users rated the product 9 or 10, but the economic buyer or team lead did not complete the survey.
2. Deploy non-leading conversational probes
When interviewing customers who submitted a survey, avoid anchoring on their numerical rating. Asking a participant why they gave a specific number encourages rationalization rather than authentic problem recollection. Structure questions around specific workflows and recent business decisions:
- "Can you walk me through what happened the last time your team exported project data for executive reviews?"
- "When you think about the renewal discussion coming up this quarter, what internal hurdles are you anticipating?"
- "What operational tasks take longer than your team expected when you first adopted the platform?"
- "What workarounds or spreadsheets has your team built to supplement the platform's current functionality?"
3. Conduct conversational fieldwork while maintaining researcher oversight
A major barrier to qualitative follow-up has traditionally been researcher bandwidth: conducting dozens of individual telephone calls consumes weeks of team capacity. Modern research teams use Pulse to run AI-moderated voice interviews with survey respondents simultaneously. Pulse conducts adaptive spoken interviews, probing vague responses and asking context-specific follow-up questions while letting researchers synthesize findings into structured, research-grade evidence within hours.
Automated voice interviews excel at operational scale, eliminating interviewer drift and standardizing inquiry across hundreds of participants. However, human researcher judgment remains non-negotiable across four areas:
- Study design and prompt guardrails: When a discussion guide contains an ambiguous definition or leading prompt, automated systems repeat the flaw systematically across every participant. Human researchers must formulate core hypotheses, set screening criteria, and define clear boundaries for automated probing.
- Emotional subtext and cultural nuance: Conversational voice systems capture literal responses and baseline acoustic tone, but they cannot reliably decode sarcastic understatement, nervous laughter, prolonged hesitation, or regional politeness norms that mask customer frustration.
- Corporate politics and evasive responses: B2B buyers frequently cite operational or technical issues to avoid discussing corporate politics, leadership changes, or executive mandates. Human researchers possess the organizational context required to recognize when a participant is deflecting and can challenge executive responses constructively.
- Strategic synthesis: Algorithmic clustering groups high-frequency keywords, but business breakthroughs often stem from a single participant's unprompted workaround or an unexpected outlier perspective. Human researchers must weigh evidence against business strategy to decide which signals warrant product investment.
4. A worked enterprise example: Diagnosing a score drop
An enterprise collaboration software provider experienced an eight-point drop in its relationship score among mid-market customers. Standard survey verbatims pointed vaguely to "performance issues" and "reporting problems."
The research team deployed five 15-minute voice interviews with passive respondents (scores 7 and 8) in the affected cohort. Rather than platform latency, the conversations revealed an operational workflow breakdown: the company's newest update had removed an unformatted CSV download that financial controllers used to reconcile monthly invoices. The new visual analytics dashboard looked modern, but controllers were spending three additional hours each month manually copy-pasting numbers into internal ledger sheets. Within 48 hours of completing the calls, product engineering restored the raw export button, stabilizing account satisfaction across the entire segment.
Common Mistakes When Connecting Quantitative Scores to Qualitative Research
Teams linking surveys to interviews frequently undermine their data by forcing customers to justify numerical scores, focusing exclusively on vocal detractors, or manually cherry-picking transcript quotes to confirm pre-existing executive theories. Rigorous qualitative follow-ups require non-leading question structures, balanced cohort sampling, and structured thematic analysis.
Avoiding three widespread pitfalls ensures qualitative research yields valid findings:
- Anchoring on the numerical score: Opening an interview by asking "Why did you rate us a 6?" triggers cognitive defense mechanisms. The respondent constructs a post-hoc justification to sound rational, emphasizing minor cosmetic flaws instead of describing their routine operational frustrations. Open the discussion around recent operational milestones instead.
- Ignoring the silent passives: Detractors (scores 0 to 6) express acute grievances that often receive immediate executive attention. However, passives (scores 7 to 8) and non-respondents represent greater enterprise risk. According to a Gartner report on customer feedback actionability by Augie Ray, only 16% of surveyed customers strongly believe organizations use feedback to drive concrete action. Customers who feel indifferent or mildly frustrated rarely spend time completing surveys; they quietly disengage, explore alternatives, and switch vendors without lodging a formal complaint.
- Unstructured transcript cherry-picking: When product leaders review customer interview transcripts manually, they tend to select quotes that validate their planned roadmap features while dismissing contradictions. Teams must apply structured thematic coding across entire transcript sets to verify that identified friction points represent systemic patterns rather than isolated outliers.
Frequently Asked Questions
Should customer research teams retire NPS entirely in favor of qualitative interviews?
Research teams should run both methods together rather than discarding quantitative tracking. Quantitative surveys provide broad longitudinal benchmarking across large accounts, highlighting sudden sentiment shifts and regional variations. Spoken voice interviews supply the diagnostic depth, operational context, and root-cause explanations that closed numeric scales cannot capture.
How quickly should researchers contact a customer after they submit an anomalous survey response?
Teams should initiate conversational follow-ups within 24 to 48 hours of survey completion. Contacting respondents while their evaluation and recent product interactions remain top of mind yields richer contextual recall, prevents memory decay, and signals to enterprise stakeholders that their feedback prompts immediate operational attention.
What is the ideal sample size for voice interviews when diagnosing a sudden metric decline?
Conducting five to eight targeted voice interviews within a specific customer cohort routinely surfaces the primary operational breakdowns causing a metric drop. If qualitative interviews with five passive users in a segment converge on the same broken workflow, engineering teams have sufficient diagnostic evidence to act.
How can insights teams report conversational qualitative findings to an executive board that prefers numerical dashboards?
Present qualitative insights by pairing verified operational themes with account-level financial exposure. Frame findings as: "X% of interviewed accounts in this cohort identified Workflow Y as their primary renewal risk, representing $Z in annual recurring revenue." Concrete quotes and operational metrics transform conversational nuance into executive-level business decisions.
Transform high-level survey metrics into clear root causes. Set up your study on Pulse and run conversational voice interviews with your customer cohorts overnight.