When a concept test says yes and the launch still fails
Concept test results overstate demand when a yes costs the respondent nothing. How to read them, what to check before launch, and what to ask after.
A voice of customer report gets acted on when it opens with the decision, shows the evidence behind each finding and names an owner.
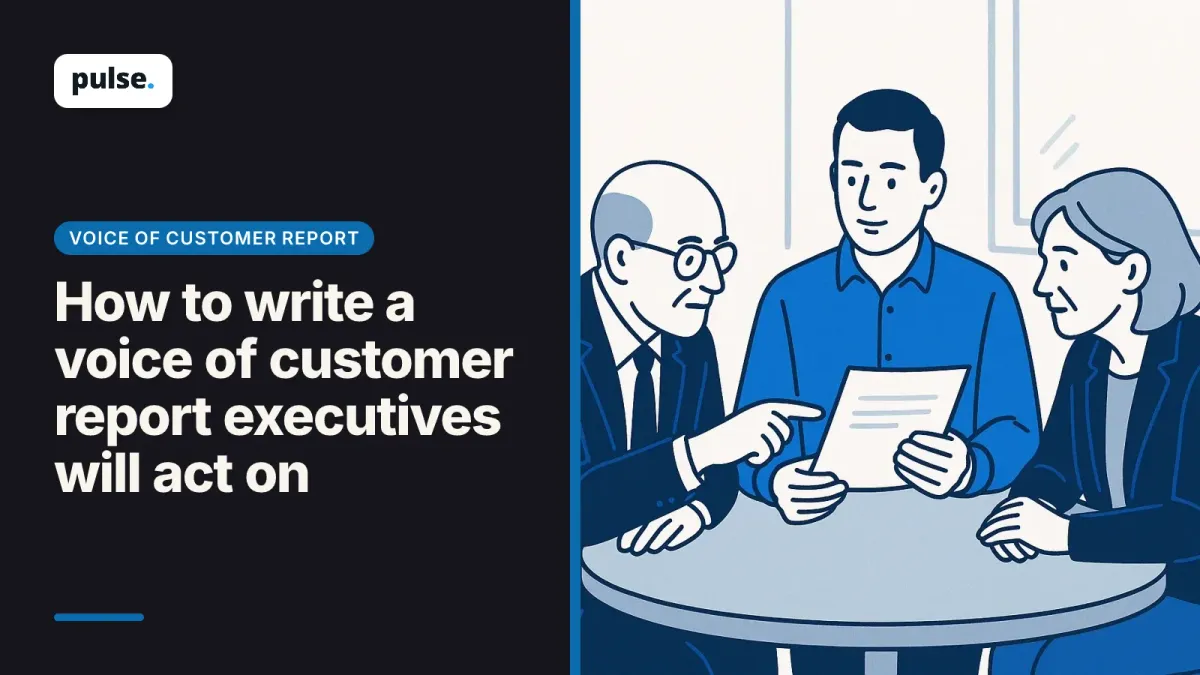
A voice of customer report that executives act on fits on one page. It names the decision coming up, the three findings that bear on it, the evidence behind each finding, and who does what by when. The scores and the full theme list go in an appendix, where anyone who wants them can find them.
A research function needs two documents, and they do different jobs. A monitoring dashboard answers "how are we doing" and is open to anyone at any time. The decision report answers "what should we do about the choice in front of us", and it arrives before that choice is made.
The evidence can come from surveys, support tickets, reviews, sales call notes and customer interviews. The report's job is to select the parts of it that bear on one decision and present them so a leader can check them.
VoC reports get shelved when they describe the customer without asking leadership to decide anything. Four habits make a report easy to shelve: the first page shows scores, themes arrive without counts, quotes have no source, and no finding ends with an owner. Each one is fixable in the next edition.
A report that opens on NPS, CSAT and channel volumes tells a leader whether things are better or worse than last quarter. That is useful, and it does not ask for a decision. By the time the themes appear on page four, the meeting has moved on.
"Customers find billing confusing" could describe one loud account or half the base. Without how many participants raised it and in which segments, a leader cannot tell a pattern from an anecdote, so the safe move is to wait.
A vivid quote with no link to its transcript invites the question of how it was picked. A skeptical reader can dismiss any quote that nobody in the room can check.
A finding without a recommendation, an owner and a date is information. When every edition also uses the same layout, nothing on the page looks new.
Write the report for one decision leadership will make in the next quarter. List what is coming up, such as a pricing review, roadmap planning, the retention budget or a market launch, and pick the decision this report informs. Then write the report's title as that decision's question.
Ask the executive who owns that decision what would change their mind. The answer tells you which evidence the report needs, and it is cheapest to ask before fieldwork starts.
A title like "Should onboarding for large accounts move to a guided setup before the Q2 roadmap is set?" tells the reader why the page exists. Every finding below it either bears on that question or moves to the appendix.
Rank findings by what they put at stake for the decision, such as account value or churn risk. Raw mention volume is a weaker guide: a theme raised in a handful of interviews with high-value accounts at risk of leaving can outrank one raised by many trial users. Say in the report which basis you used to rank them.
Put each finding in the terms leadership funds. In the release for its 2025 CX Index, Forrester states that even a minor improvement to a brand's customer experience quality can reduce churn and increase share of wallet. That is Forrester's general position. Tie a finding of yours to churn or revenue only where your own data shows the link, and write "associated with" unless your analysis establishes cause.
Write every finding in five parts: a one-sentence claim, how many participants raised it and in which segments, one or two verbatim quotes traced to their transcripts, the team's interpretation labeled as such, and a recommendation. Executives forward a single slide or paragraph, so each finding has to make sense on its own.
The table below is an illustrative example, with invented figures, of the same finding written two ways.
| Part | Weak finding | Strong finding (illustrative) |
|---|---|---|
| Claim | Customers find onboarding confusing | New enterprise accounts stall at the user-permissions step in their first week |
| How many, and who | Not stated | Raised in 14 of 22 onboarding interviews, mostly accounts with more than 50 seats |
| Evidence | One quote, no source | Two quotes, each linked to its transcript |
| Interpretation | Mixed into the claim | Labeled: admins expected roles to copy over from their existing directory |
| Recommendation | "Improve onboarding" | Add role import to setup; owner, onboarding product lead; decision at the Q2 roadmap review |
Keep what customers said, what the team infers and what it recommends in separate sentences. A leader who disagrees with the interpretation can still accept the evidence and act on the recommendation.
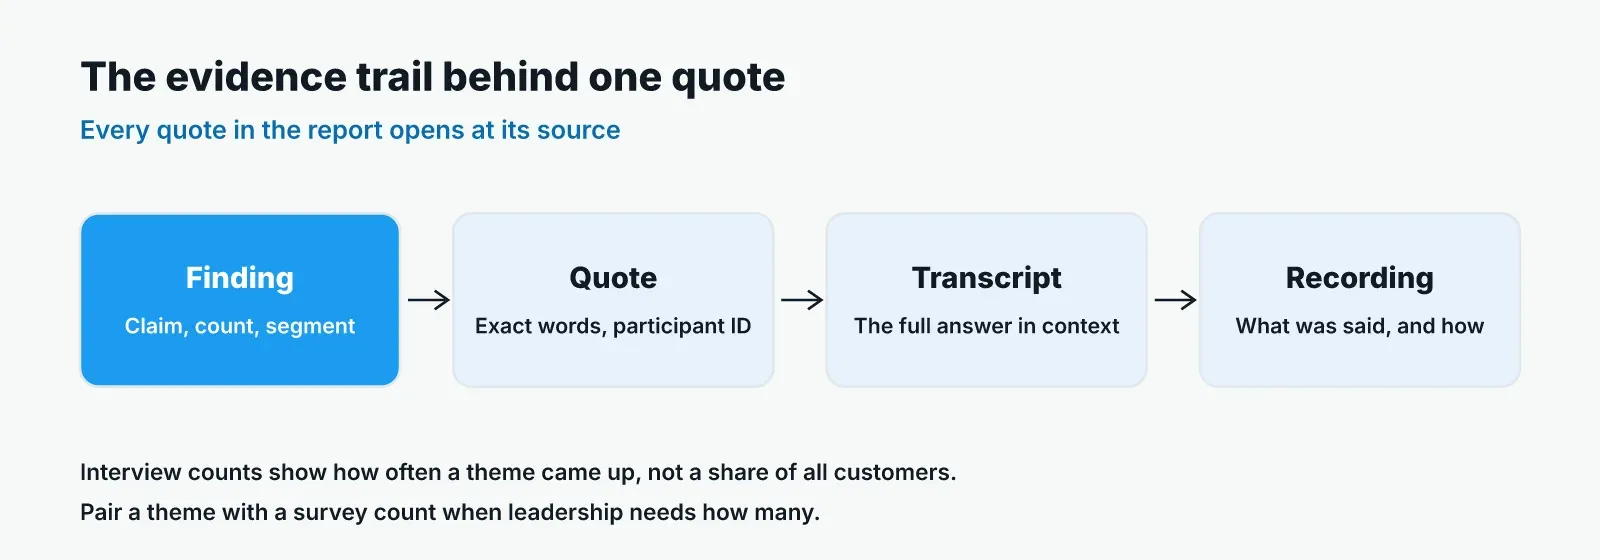
Link every quote in the report to its transcript or recording, so a reader can open the context in one click. State the sample for each segment, and present interview counts as how often a theme came up in the interviews, never as a share of all customers. Where leadership needs a share, pair the theme with a survey count.
A verbatim quote carries weight because the customer chose the words. Quote it exactly, with filler words left in if they carry meaning, and attach the participant ID and segment.
Interviews and surveys answer different questions in the same report. Teams that pair the survey count with interview reasons can say both how many customers are affected and why. Where interviews were spoken, spoken answers surface reasons a typed reply hides, which is one reason to link a recording and a transcript.
When the evidence conflicts, show it. If survey comments point one way and interviews point another, put both on the page, name the segment each came from, and say what the team would need to resolve it. A report that hides a conflict loses the reader the first time someone in the meeting has seen the other data.
Keep the scores leadership already tracks, such as NPS, CSAT and customer effort score, in a compact panel beside the findings. Show two or three of them, their trend over the last few periods, and the reason attached to each movement.
Executives also see external benchmarks. Forrester's 2025 CX Index analyzed more than 275,000 customers' perceptions of 469 brands across 12 industries and 13 countries, according to Forrester's June 2025 release. If leadership tracks an index like this, note where it sits in the panel, and keep the report's attention on explaining your own movement.
Choosing which metric to act on is a separate decision, and the report does not need to settle it.
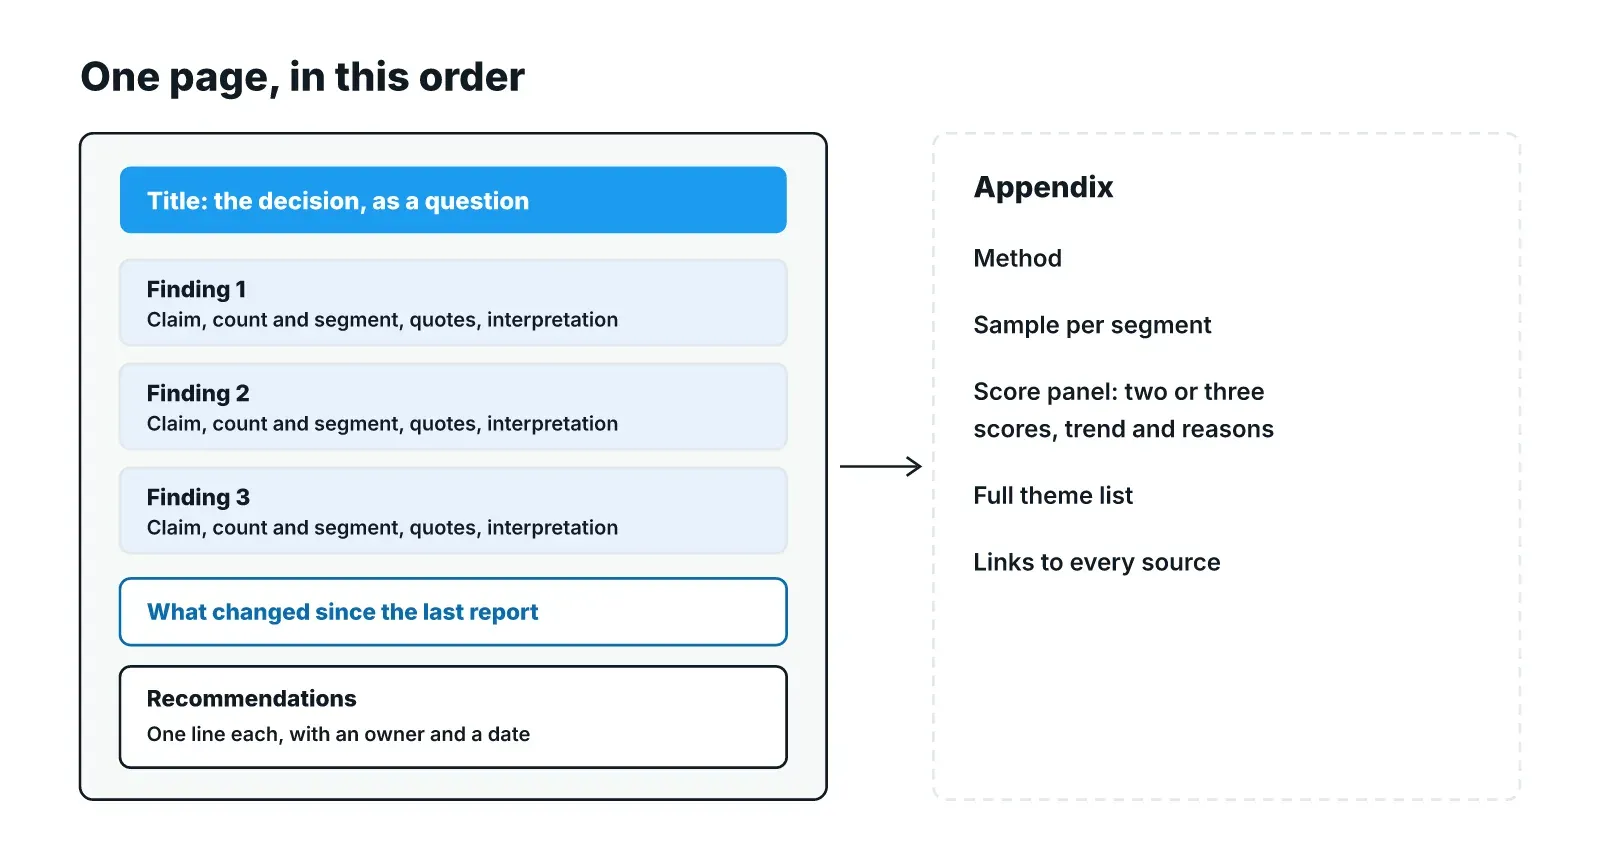
The page has five parts, in this order: the decision question as the title, three findings in priority order, what changed since the last report, recommendations with owners and dates, and an appendix. The appendix holds the method, the sample, the score panel and the full theme list with links to the sources.
| Part | What it holds |
|---|---|
| Title | The decision, written as a question with its deadline |
| Three findings | Each in the five-part form, highest stakes first |
| What changed | Themes that grew, faded or appeared since the last edition |
| Recommendations | One line each, with an owner and a date |
| Appendix | Method, sample per segment, score panel, full theme list with source links |
This example is illustrative. The claims unit of a large insurer sends a quarterly report to its steering committee. This quarter's title asks whether claim status updates should move from callbacks to proactive messages before the next budget round.
The first finding says claimants call the contact center when they hear nothing in the days after filing, with quotes from interviews across both personal and commercial lines. The second says commercial brokers want one status view for all their clients' claims. The third, carried over from last quarter, shows that complaints about repair delays have faded since the approved-garage process changed.
Each recommendation names the claims operations lead or the digital product lead and a date before the budget round. The appendix lists the interviews by line of business and links every quote to its transcript.
Pulse groups interview responses into themes with quotes traced to their transcripts, delivers a recording with each interview, and keeps every study in a searchable repository, so the "what changed" section can show how the same theme moved across quarters.
A VoC report, or voice of customer report, summarizes what customers say and do about a product or service for the people who make decisions about it. It draws on surveys, support contacts, reviews and interviews, and the useful version connects that evidence to a specific decision with an owner for each next step.
There is no single VoC score. A voice of customer report tracks named metrics, such as NPS, CSAT or customer effort score, and what counts as good depends on the metric, the industry and your own history. Report the metric, its trend and the reasons behind each movement rather than one number.
Include feedback that bears on the decision the report serves: survey scores and comments, support contact reasons, reviews, sales call notes and interview findings. Leave the rest in the appendix or the repository. A theme belongs on the page when you can say how many participants raised it, in which segments, and link to the source.
Match the report to the leadership calendar rather than a fixed monthly send. A quarterly decision report timed a few weeks before planning suits a steering committee that meets quarterly, with the monitoring dashboard available in between. Send an extra edition when a finding bears on a decision that cannot wait for the next cycle.
One page for the decision, with an appendix as long as the method and sources need. If three findings and their recommendations do not fit on one page, the report is probably serving more than one decision. Split it, and send each part to the leader who owns that decision.
Concept test results overstate demand when a yes costs the respondent nothing. How to read them, what to check before launch, and what to ask after.
How do AI interviews work in customer research? Follow one session from screener to follow-up question to a theme traced to its transcript.
Jobs to be done research gets harder when one account has many roles and business units. How to recruit, interview and merge jobs across them.