Participant recruitment methods: 5 ways to find people
Participant recruitment methods compared by who you need: your own list, panels, referrals, networks and recruiters, plus a check before you set a date.
Customer insights vs customer analytics: dashboards show what changed, research shows why. A quick check for which gap your team has.
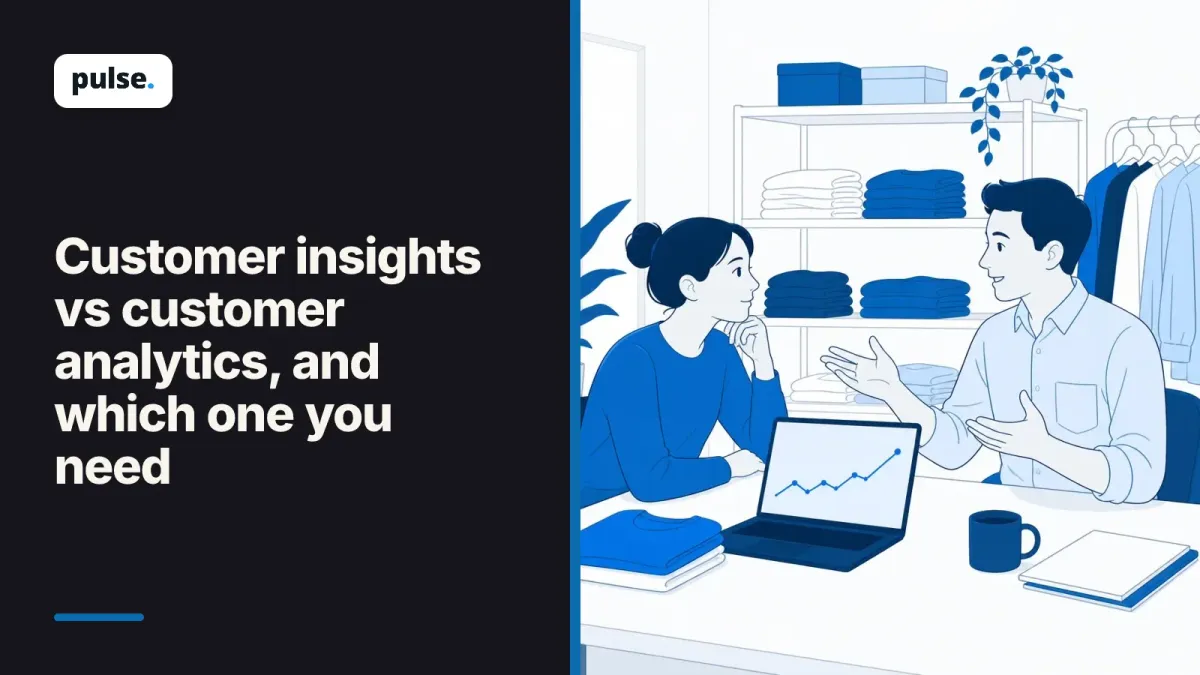
"Why did they stop buying from us?" That's what your manager at the clothing retailer where you work wants to know. The loyalty app dashboard already shows which members stopped buying, and when. So what kind of software can answer her?
Most tools sold as customer insight software do one of two jobs, and the difference between customer insights vs customer analytics decides which one helps you here.
If you need to see who changed and when, you need analytics. If you need to know why they changed, you need to ask them, in interviews or surveys built for that. Your manager's question is a why question, and the dashboard has already done its part.
So before anyone books a demo, start with one check: which kind of question is on your desk right now?
Customer analytics counts what customers do, using records you already have. Customer insights, in the research sense, explain why customers do it, using what they tell you. Both get sold under the same name, so a search for customer insight software can show you two very different kinds of product on one page.
Say the research team at the clothing retailer searches for customer insight software. The results mix a customer data platform, a tool that scores each customer's health, and a tool for running customer interviews. They look like rivals, but they answer different questions.
Analytics and data platforms join records you already hold, such as online orders, store visits, loyalty points and support tickets, into one view of each customer. Then they sort customers into groups and show trends over time. Research software collects something new: answers from customers, in their own words. Those answers become qualitative insights, which means findings built from what people say rather than from what they click.
Some products even carry "customer insights" in their name and are data platforms underneath.
The table shows which kind of software answers each question the retailer's team might have.
| Question | Analytics can show | Research can explain | Clothing retailer example |
|---|---|---|---|
| Who stopped buying? | Yes | No | Members who used to buy every season |
| When and where did it start? | Yes | No | The month the points rules changed, mostly online |
| What do they say changed? | No | Yes | The points change, a rival's sale, a new returns fee |
| What would bring them back? | No | Yes | Free returns again, a different reward, nothing at all |
| How common is each reason? | Checks it afterwards | Yes, with a survey | How many members name the points change |
The two kinds of software hand work to each other. Analytics gives you the list of who to ask. Research gives you the reasons. Then analytics shows you whether the fix brought those members back.
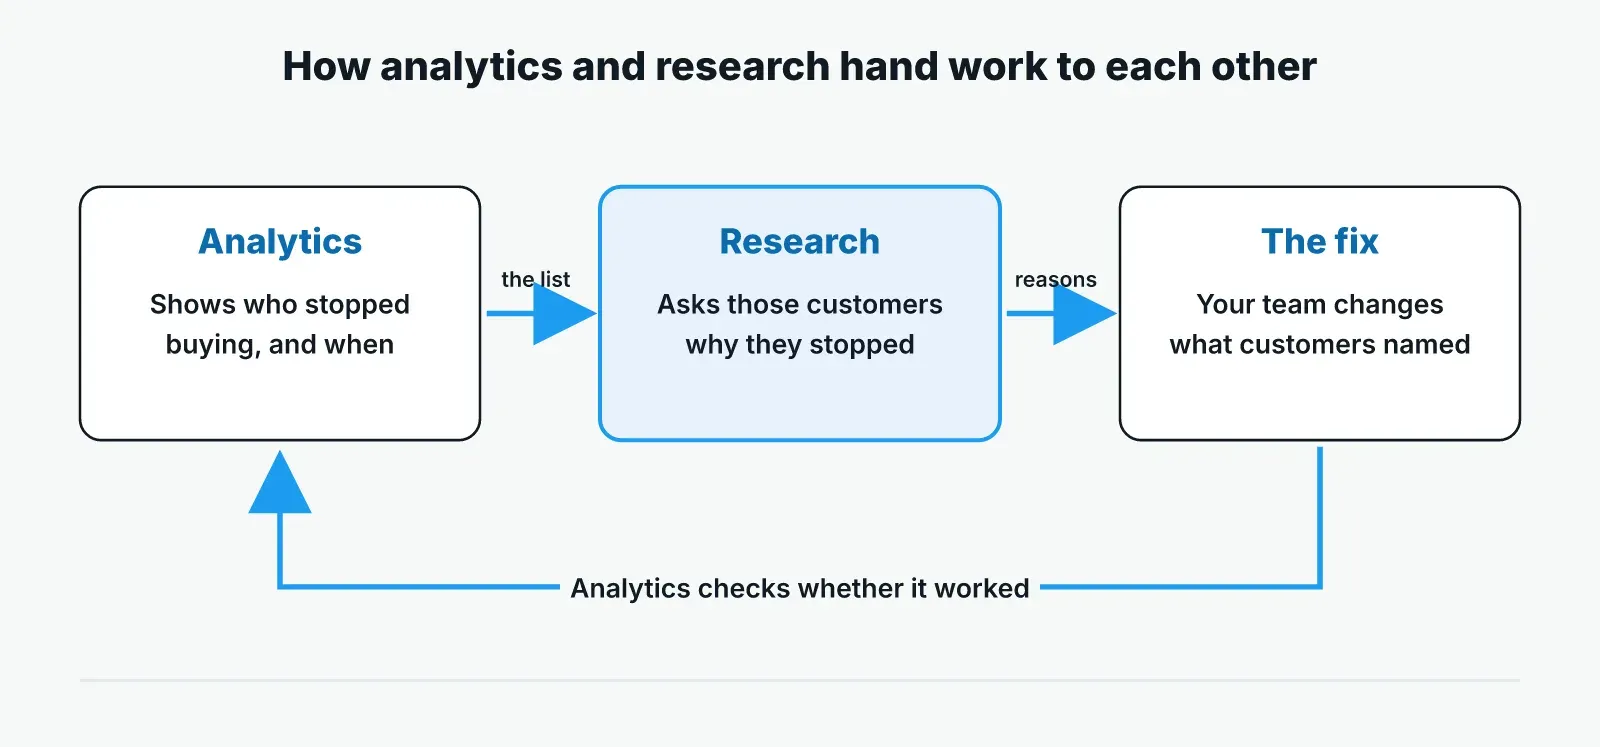
A dashboard can tell you that online orders from loyalty members fell after the points rules changed. It can't tell you whether the points change caused the drop. The same chart fits several stories, and each story points to a different fix, so the team needs a way to tell them apart.
Maybe members felt the new points rules were worse. Maybe a rival ran a bigger sale that season. Maybe the new range fits differently, so people stopped trusting their usual size. Or maybe the new fee on returns put them off buying online.
Say the team guesses it was the points change and rolls the old rules back. Orders stay flat, because the real reason was the new fee on returns. The team has spent a quarter fixing the wrong thing, and the members who left are still gone.
More data rarely closes a why gap. Adding site visits and app clicks sharpens the picture of what happened. But the reason lives in each customer's head, so someone has to ask them, and then ask a second question when the first answer is vague.
A survey with a text box helps a little. As the post on a score plus a text box explains, a typed comment gives you a hint, and the reason usually sits one question deeper.
The chart tells you where to look. Only the customers can tell you what to fix.
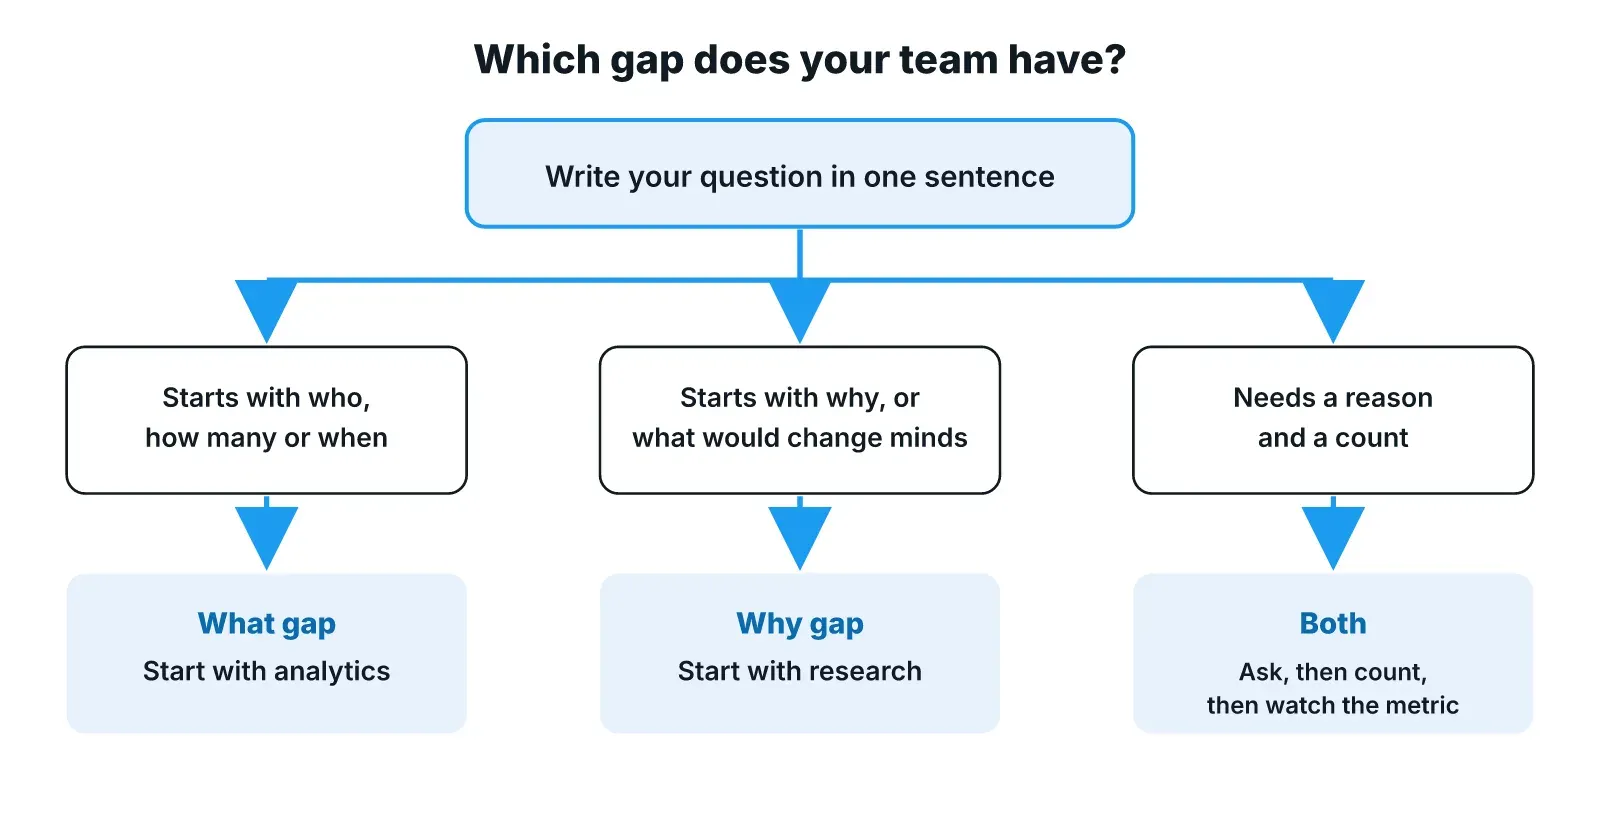
You can work out which kind of customer insight software you need without talking to any vendor. Write down the question your team must answer this month, then look at how it starts. Questions about who, how many and when point to analytics. Questions about why point to research. Many real questions need both, in a set order.
"Why did online orders from loyalty members fall after the points change?" is a question you can answer. "How do we understand our customers better?" is not.
That's a what gap. You need to see behavior you can already measure, so start with analytics and the data you already hold.
That's a why gap. The answer isn't in any table you own, so start with research and talk to the customers involved.
Talk to customers first to learn the reasons in their words. Then run a short survey to see how common each reason is. Finally, watch the same metric on the dashboard after the fix.
In a large company, these two kinds of software usually sit with different teams. The data team owns the dashboards, and the research team owns the interviews and surveys. Studies often stall in the gap between them, because nobody owns the list of customers who changed.
If the dashboard already shows the change, the next purchase is a way to ask why.
If your gap is a why gap, test research software on how well it gets reasons from the right customers, at the scale a large company needs. A demo of nice charts tells you little, so these questions test the parts that decide whether the retailer's team gets a usable answer in time.
There's also a third group of products to know about. Survey-led feedback suites, often called voice of customer platforms, collect ratings and comments at scale. Analysts still cover them as their own category: Gartner's 2026 Magic Quadrant for Voice of the Customer platforms covers 12 vendors, as CX Today reported in March 2026. If your company already runs one, the post on voice of customer programs built on conversations shows how interviews sit beside it.
The research team at the retailer knows which members stopped buying. What it needs is to hear why from enough of them, quickly, and to trust that each reason came from a real customer. That's the why gap, and Pulse runs AI-moderated voice interviews to close it.
Members take the interview on a phone or laptop by opening a link, so there are no calls to schedule. The AI moderator's follow-ups build on what each person said earlier, and a vague answer gets a second question. You can upload the list of members your analytics flagged, or bring it straight from your customer database through a connector, one of 1,500+ that run through MCP.
Pulse then groups what people said into themes with the quotes behind each, and every quote links to its transcript. A survey can run in the same study to count how common each reason is. The report builds as interviews finish and is ready minutes after the last one.
So the work splits cleanly. Your analytics shows the change, Pulse gets the reasons, and your team decides what to fix. You can try it with a free trial and a free study, or book a demo to see it run on your own question.
Customer insight software is a broad label for tools that help a company understand its customers. It covers two different jobs. Analytics and data platforms join the records you already hold to show what customers do. Research software asks customers questions to learn why they do it. Check which job a product does before comparing prices.
A customer data platform can show which customers left, when they left and what they did before leaving. It can't tell you their reasons, because those were never recorded in your systems. To learn why, you need to ask the customers who left, then check how common each reason is.
Buy for the question you can't answer today. If you can't see who changed or when, start with analytics, because research needs that list to know who to ask. If your dashboards already show the change clearly, start with research. Most large companies end up running both.
A customer insight is a finding about why customers act as they do, backed by what they said. "Members stopped buying online because returns now cost money" is an insight. "Online orders from members fell" is a metric. The metric tells you where to look for the insight.
Participant recruitment methods compared by who you need: your own list, panels, referrals, networks and recruiters, plus a check before you set a date.
Semantic vs latent themes, from Braun and Clarke's paper "Using thematic analysis in psychology", shown on real-life quotes, with when to use each.
How to choose a transcription service for research interviews: test each option on your own audio with five simple checks, from accuracy to data safety.