Participant recruitment methods: 5 ways to find people
Participant recruitment methods compared by who you need: your own list, panels, referrals, networks and recruiters, plus a check before you set a date.
Switching brand tracking providers? Compare the old and new tracker, run a bridge wave and keep a trend line the people deciding will still trust.
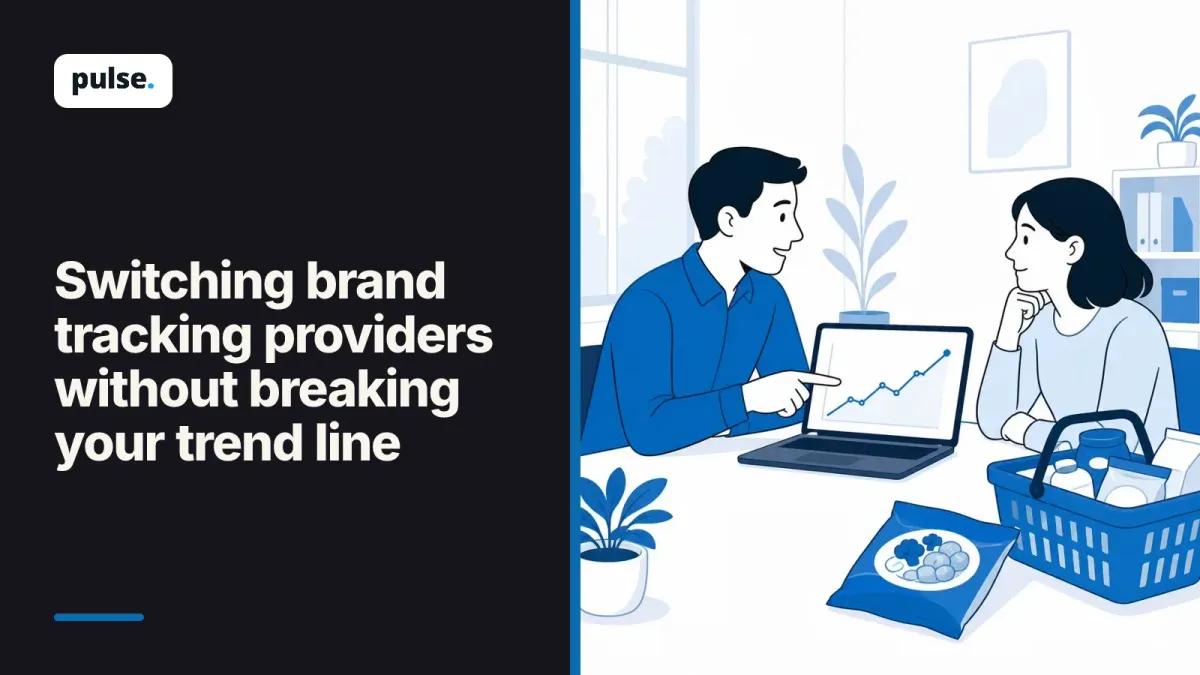
You're on the brand team at a frozen food maker company. The brand tracker contract is up for renewal, and a new provider can run it every month. But years of trend live with the old one. How do you switch without losing them?
Switching brand tracking providers can make the chart jump for reasons that have nothing to do with your brand.
To keep the trend, you copy your core questions word for word, match the sample as closely as you can, and run both trackers side by side for at least one wave. Then you show the gap in the chart before anyone reads a new number.
So what decides whether the line holds? Three things: what you compare, how you run the overlap and how you explain a change.
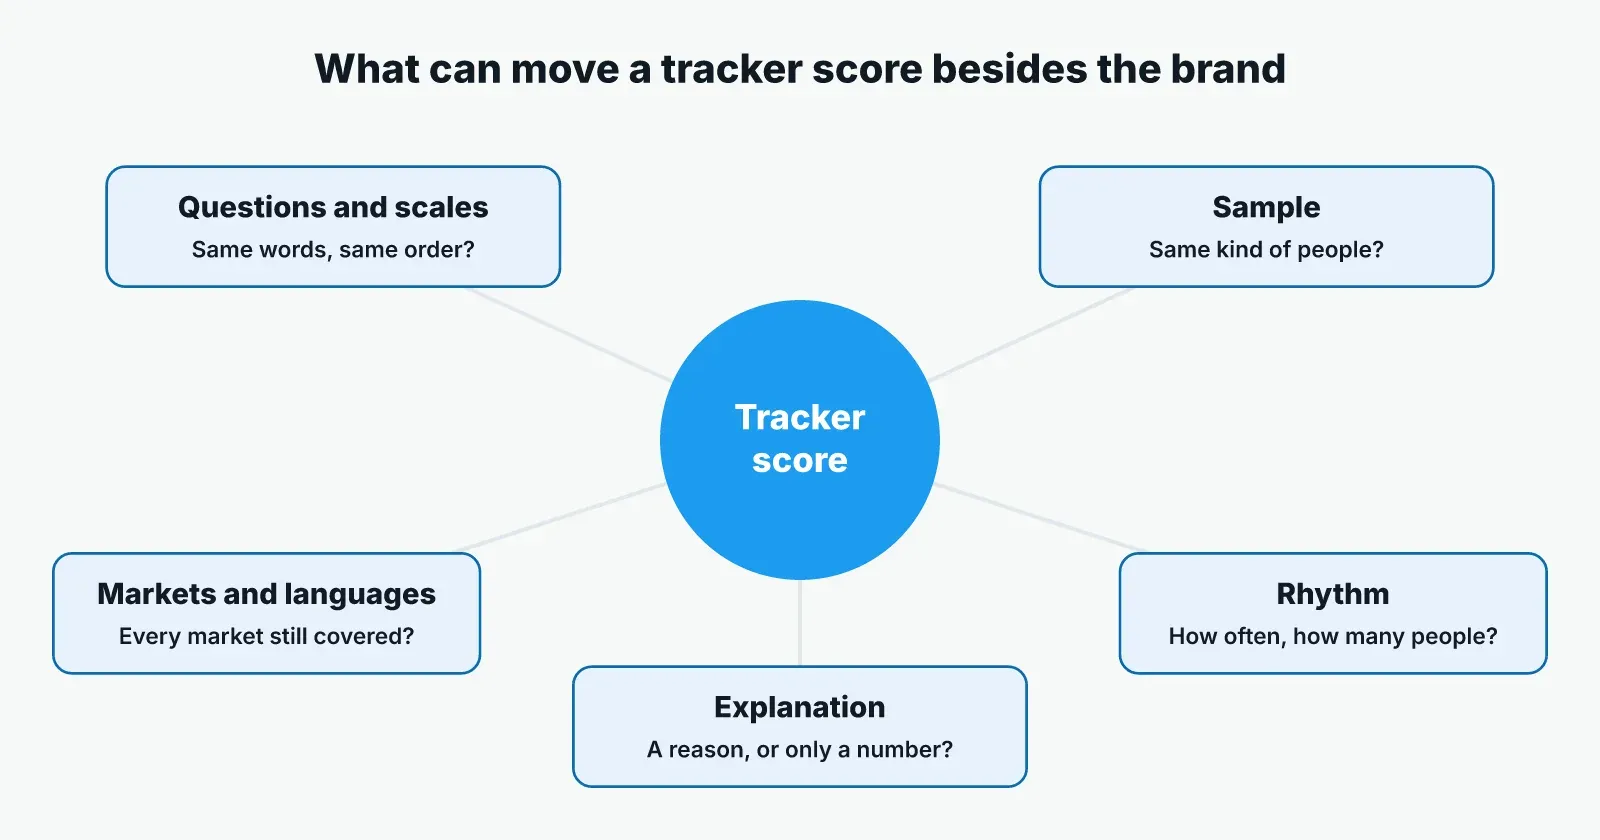
A tracker score moves when the brand changes, but it also moves when the way you measure changes. Switching brand tracking providers usually changes several things at once: the wording of the questions, the answer scale, the people in the sample and even the time of year the survey runs.
Each of those can shift a number on its own. Ask "Which frozen food brands have you heard of?" and you get one answer. Show a list of logos first and you get a higher one. A new panel, which is the pool of people a provider invites to surveys, can hold more heavy buyers of frozen food than the old one did.
Say the new tracker goes live in March, and your awareness score drops five points that month. Your manager asks what went wrong with the brand. You can't tell, because the brand and the method changed in the same month.
Survey-based trackers and mention-monitoring tools are two different kinds of brand tracking software. Survey trackers ask people like your buyers the same questions every wave. Monitoring tools count mentions of your brand online. They measure different things, so a monitoring tool can't take over a survey tracker's trend, and the two lines should never be joined on one chart.
Before you look at dashboards or prices, compare the parts of each tracker that set the number. If the new provider can match the old one on these, your trend has a good chance of surviving the switch. If it can't, you'll need a longer bridge and a clear note in every report, so each row below starts from a question you can put to the new provider.
Part of the tracker | What to ask the new provider | Why it moves the score |
|---|---|---|
Questions and scales | Can you ask our questions word for word, in the same order, with the same answer options? | A small change in wording or order changes how people answer |
Sample | Where do participants come from, how are they checked, and can you match our quotas? | A different mix of people gives a different average |
Markets and languages | Can you cover every market we track, in the languages we use now? | A missing market breaks the total line |
Rhythm | How often does a wave run, and how many people take part each time? | More frequent waves with fewer people per wave move around more |
Explanation | When a score changes, do we get open answers or interviews, or only the number? | Without a reason, a change starts an argument |
Old data | Can we load our past waves beside the new ones? | Without the history, there is no trend to protect |
Three metrics deserve the most care, because they are the ones leaders follow. Awareness is how many people know your brand. Consideration is how many would think about buying it. Preference is how many would pick it over the rest. Keep their questions and scales exactly as they were, even if the new provider suggests better ones.
Awareness has a reason of its own to protect. A study from Google with a brand tracking company looked at 31 brands across 15 categories, as reported by Westwood One's Audio Active Group in August 2026. It found that every five points of awareness growth went with about five points of share-of-search growth. Share of search is the share of all searches in a category that name your brand.
In plain words, awareness tends to move with how often people look your brand up. So a broken awareness line hides a signal your marketing team uses, which costs you more than a messy chart.
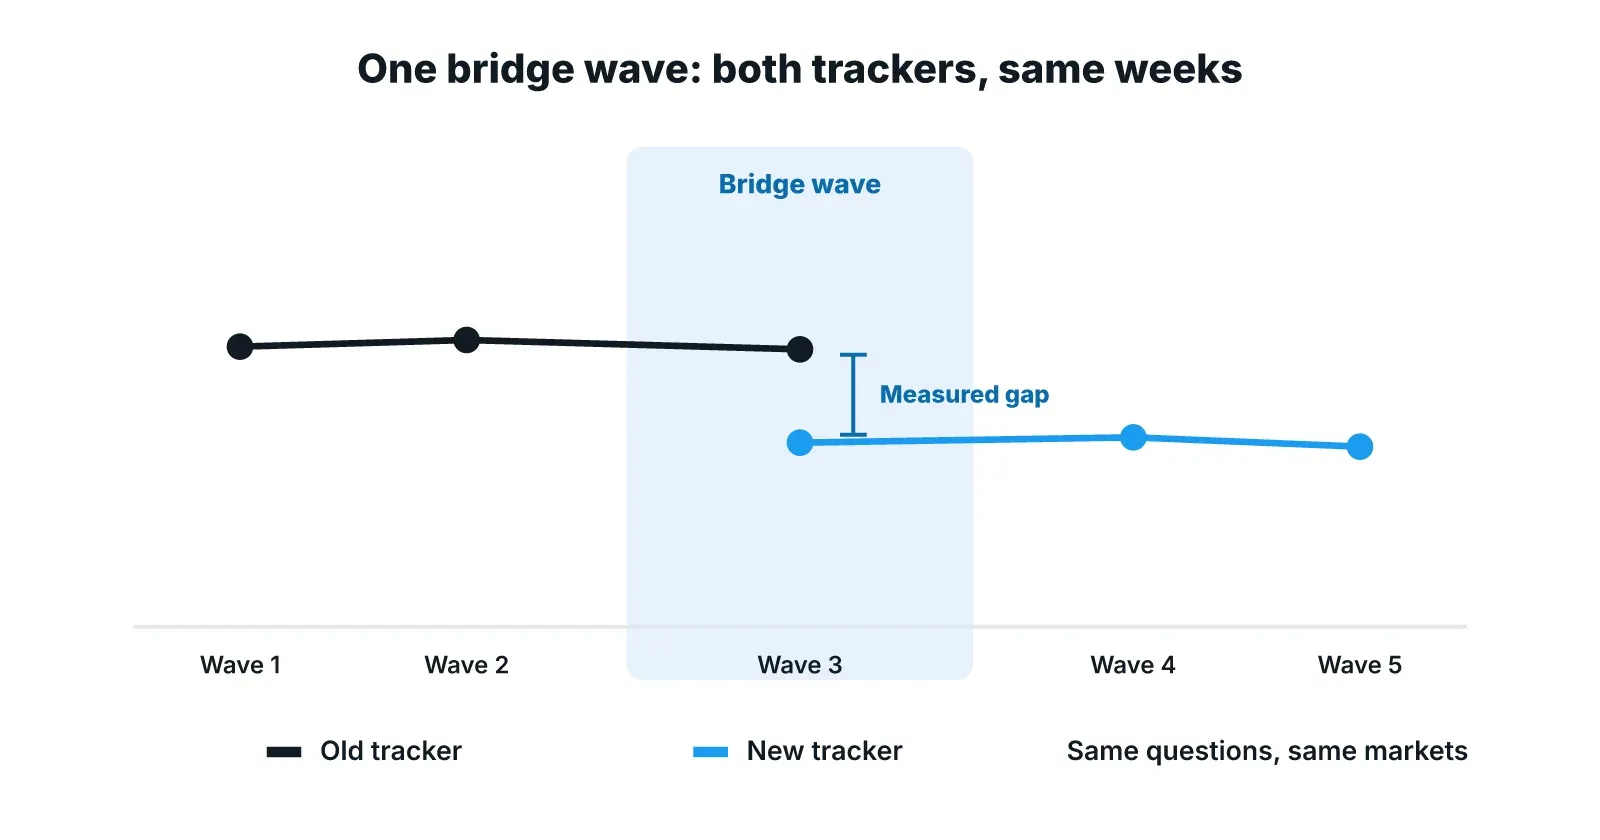
A bridge wave is a period when the old and new trackers run at the same time, on matched samples. It turns "the score dropped" into "the new method reads three points lower, and the brand held steady", which is a sentence your manager can accept.
The question is narrow. How much of any difference between the two trackers comes from the method? Write it down before either wave starts, so nobody reads the bridge as a test of the brand.
Run the old tracker's last wave and the new tracker's first wave in the same weeks, in the same markets. Ask the same questions to the same kind of people. If frozen food buying rises in winter, both waves should see the same winter.
Lay the two sets of numbers side by side. Say the new tracker reads awareness three points lower in every market, and consideration about the same. That pattern points to the method, and the three points become your bridge.
You have two honest choices. You can mark a clear break in the chart and start a new line, or you can adjust the old history by the measured gap and say so in a footnote. Agree the choice with the people deciding before the first new report, so the switch is never a surprise.
If the gap is the same across markets and metrics, adjust and move on. If it changes from one market to the next, keep the break in the chart and explain each market on its own.
A tracker tells you that a score moved. It can't tell you why, and "why" is the first thing your manager asks. A short round of interviews with people from the group whose score changed gives you the reason in their own words.
Say consideration for the company's frozen meals drops in one market two waves after the switch. The bridge says the method reads the same there, so the drop is real. The research team invites 15 shoppers from that market who know the brand but no longer consider it.
The interviews ask what those shoppers buy now, when they last bought the brand and what changed. Suppose several say a new lower-priced range made them think the main meals had shrunk. That is a packaging and naming problem, and extra tracker questions would not have shown it.
The decision changes too. Without the interviews, the team might cut prices. With them, it checks the pack design and the range name first.
For the numbers themselves, see which brand health metrics move a decision and how to run a brand awareness survey. If the switch also brings a faster rhythm, continuous brand tracking covers what changes.
The hard part of a switch is keeping the numbers comparable and finding the reason when one moves. That is the work Pulse is built for.
Pulse runs trackers that repeat the same questions each wave, so a change shows against the baseline, and AI-moderated interviews can explore that change in the same study. Surveys run alongside the interviews, so the number and the reason arrive together. One study can run across several markets from one brief, and every theme links to the quotes and transcripts behind it.
That leaves your team the part that needs judgment: which questions to keep, how the chart shows the switch and what to do about what shoppers say. Pulse brand tracking software runs the waves and the interviews, and a researcher reads the themes against the transcripts before a decision rests on them.
Use this rule for the switch: keep the core questions, run one bridge wave, and never report a moved score without a reason. To see a tracker wave and its follow-up interviews in one study, book a demo, or start with a free trial and a free study.
Brand tracking software measures how people see a brand over time, usually through a survey that asks the same questions every wave. The core measures are awareness, consideration and preference, often split by market and by type of buyer. Some tools also count online mentions, which is a different measure called brand monitoring.
It depends on how fast your market moves and how you'll use the result. A brand with frequent launches or heavy advertising may want monthly waves. A slower category can read quarterly waves well. More waves with fewer people each will move around more, so agree how big a change must be before anyone acts on it.
Often, yes, even when nothing about the brand has changed. New wording, a new sample or a new panel can shift each score up or down. That is why a bridge wave matters: it measures the gap the method creates, so you can separate it from real change in how people see the brand.
Participant recruitment methods compared by who you need: your own list, panels, referrals, networks and recruiters, plus a check before you set a date.
Semantic vs latent themes, from Braun and Clarke's paper "Using thematic analysis in psychology", shown on real-life quotes, with when to use each.
How to choose a transcription service for research interviews: test each option on your own audio with five simple checks, from accuracy to data safety.