
When a concept test says yes and the launch still fails
Concept test results overstate demand when a yes costs the respondent nothing. How to read them, what to check before launch, and what to ask after.
Customer satisfaction metrics help leadership only when each is tied to a decision. Match CSAT, NPS, CES and churn to what they trigger.

A leadership review sees satisfaction drop in one market, talks it over, and ends with no decision and no owner. Customer satisfaction metrics earn a place in that room only when each one is tied to a decision someone owns. Act on a movement when it arrives with its segment, its reason and the person who will fix it.
The cost of getting this wrong is quiet. Dashboards grow, reviews turn into debates about noise, and the one segment that is about to churn waits a quarter for attention.
The two tables below tell you which metrics belong on the leadership dashboard, who owns each one, and what a movement should set off.
Customer satisfaction metrics come in two kinds. Attitude scores, such as CSAT, NPS and CES, record what customers say about an interaction or a relationship. Behavior measures, such as retention, churn and repeat purchase, record what customers did. Leadership needs both, because they answer different questions and can move in opposite directions.
| Metric | What it measures | Where the number comes from | When it is taken |
|---|---|---|---|
| Customer satisfaction score (CSAT) | How happy a customer was with one interaction or step | A short rating question | Right after the interaction |
| Net promoter score (NPS) | How likely a customer says they are to recommend you | A 0 to 10 question | Every few months, in a relationship survey |
| Customer effort score (CES) | How hard it was to get something done | A rating of effort or ease | After a service contact or a task |
| Retention and churn | The share of customers kept or lost in a period | Account data | Every reporting period |
| Repeat purchase or expansion | Whether customers buy again or buy more | Transaction data | Every reporting period |
Satisfaction and success are different things. Satisfaction is how customers rate their experience. Success is whether they got the result they bought the product for. Retention sits closer to success, so it carries more weight when the decision is about revenue.
For illustration, a customer of a payroll provider can rate last week's support call five out of five and still decide not to renew, because their own business has outgrown the product. CSAT recorded the call. Churn recorded the relationship.
All five metrics are quantitative data. They show how much and how many. None of them records why. For what an NPS number leaves out, see the question an NPS score leaves open.
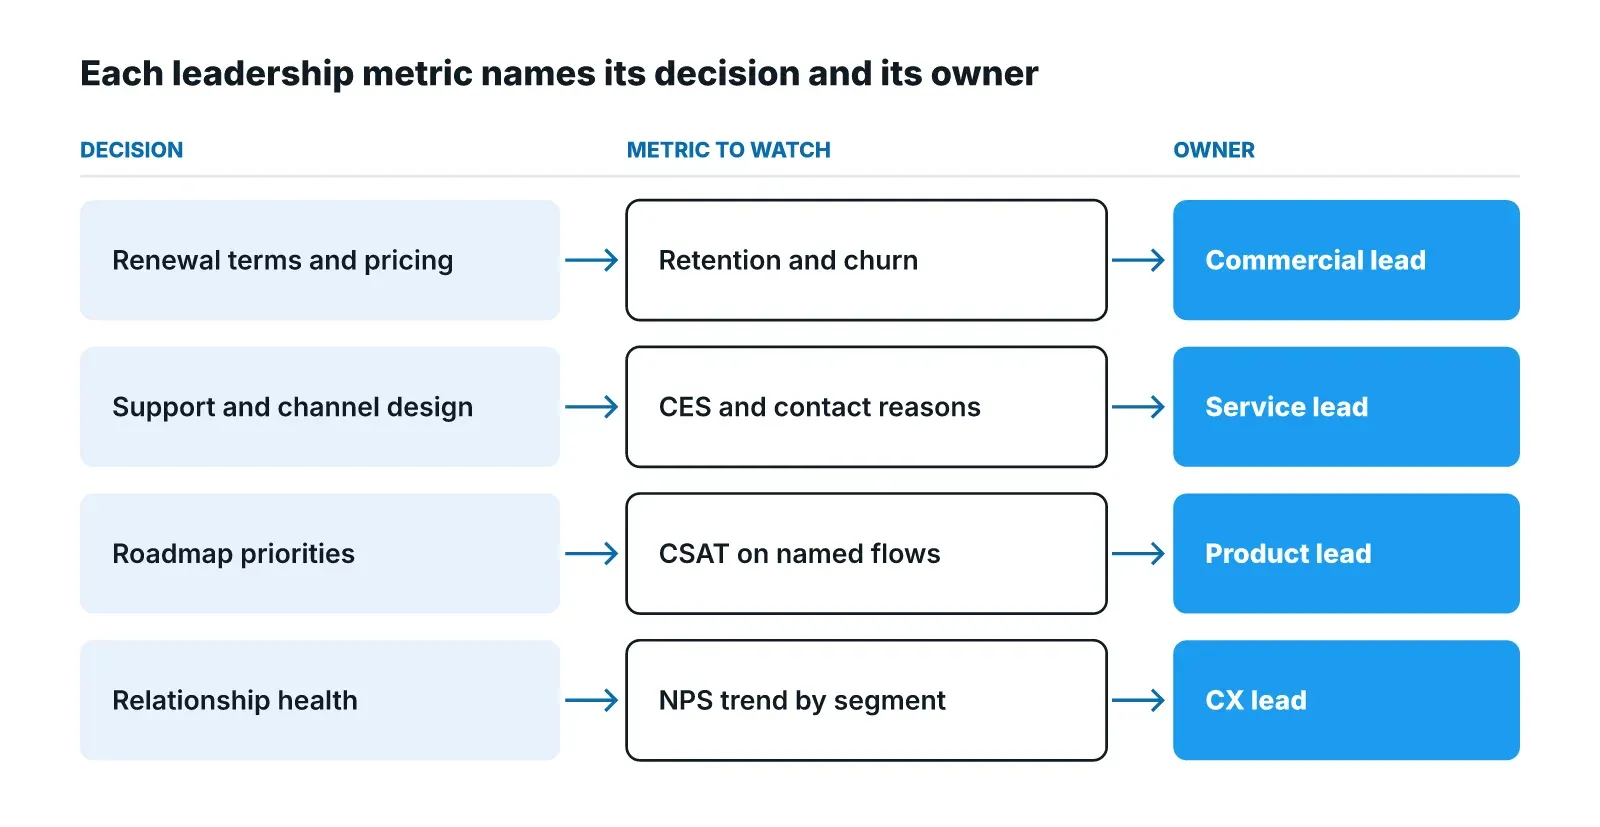
Each metric on a leadership dashboard should name three things: the decision it informs, the person who owns that decision, and the size of change that sets off a follow-up. A falling score with no owner and no threshold produces a discussion in the review and no action after it.
| Leadership decision | Metric to watch | Owner | What a movement should set off |
|---|---|---|---|
| Renewal terms and pricing | Retention and churn, by segment | Commercial lead | Interviews with recent churners and at-risk accounts in that segment |
| Support staffing and channels | CES with contact reasons, by channel | Service lead | Interviews with high-effort contacts on that channel |
| Roadmap priorities | CSAT on named product flows, and churn reasons | Product lead | Interviews with low scorers on that flow |
| Brand and relationship health | NPS trend, by segment and market | CX lead | Relationship interviews in the segment that moved |
Write each threshold down before the quarter starts, per segment, in the unit the metric uses. Then the review spends its time on what to do, and no time arguing about whether a change is real.
In a large company, one metric often matters to several leaders. Churn matters to the commercial lead and the product lead at once. Give it one owner for the follow-up, and send the findings to the others.
The same test tells you what to take off the leadership dashboard:
These numbers still matter. They belong in the report of the team that runs each touchpoint, where someone watches them daily and can act without waiting for leadership.
A score movement shows the direction and size of a change among the customers who answered. It does not show the reason. Leadership can see that satisfaction fell in one segment and still have no idea what to fix. So treat a movement as the signal to go and ask, and check two things before you react.
First, split the number by segment. An average across all customers hides the group that is moving. A steady overall CSAT can sit on top of one market that is falling while another rises.
Second, check who answered. Scores come only from customers who reply to surveys. A customer who has stopped using you may have stopped answering too, so a steady score can rest on a shrinking group. Show the response count beside every score.
Public indexes have the same limit. The ACSI Energy Utilities Study 2026, released by the American Customer Satisfaction Index on 24 March 2026 and based on 33,759 completed surveys from January to December 2025, reported overall customer satisfaction down 1% to a score of 73 on a 0 to 100 scale. The index shows that satisfaction fell. It cannot tell any one utility which of its customers moved, or what would bring them back.
Your own metrics work the same way. A rise in CES on the phone channel says effort went up. It does not say whether the cause was a new identity check, a longer queue or a policy change that pushed more people to call.
Illustrative example: the cards business of a large retail bank sees CES worsen on its phone channel in two of its markets. The change crosses the threshold the service lead set at the start of the quarter. The question is what made calls harder there, and whether to fund a fix before the next review.
The service lead has three options.
| Option | What it can tell you | What it cannot tell you |
|---|---|---|
| Wait for next quarter's score | Whether the change lasts | Why it happened, and the quarter is gone |
| Add an open-text question to the survey | A short phrase from some customers | The full story behind a hard call, or a follow-up question |
| Interview recent high-effort callers in both markets | What happened on the call, in their words, and what they did next | How many customers share each reason, which the survey count shows |
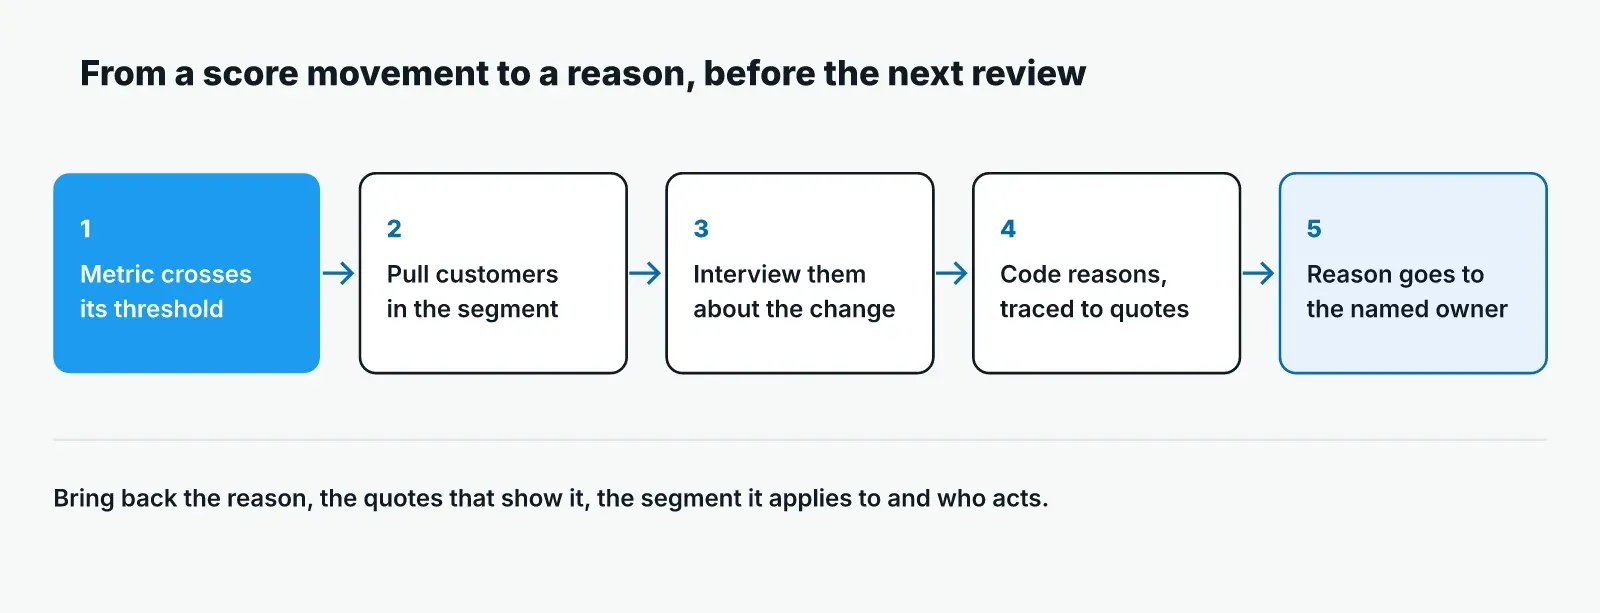
The service lead picks interviews, because the decision is about what to fix, and only a conversation gets to what happened on the call. The steps take one reporting cycle.
Take the high-effort callers from the survey data in the two markets that moved. Add a few low-effort callers from the same markets so you can compare.
Ask what they were trying to do, what happened at each step and what they did afterwards. Keep it to the interaction that moved, not their whole view of the bank.
Talk to customers in both markets, so you can see whether one reason explains both or each market has its own.
Group what people said into reasons. Keep every reason linked to the interviews behind it, so anyone in the review can read the quotes.
Bring the reason, the quotes, the markets it applies to and the owner to the next review. The discussion then moves from "effort is up" to whether to fund the fix.
Use this rule for every metric on the dashboard. When it crosses its threshold, the owner brings back a reason from the customers behind it before the next review. A metric that cannot meet that rule moves to the team that runs the touchpoint.
The slow part of this method is getting the interviews done inside one reporting cycle. Pulse runs surveys alongside AI-moderated voice interviews, so the score and the conversations that explain it sit in one study. It invites your own customers by link, with no call to schedule.
The AI moderator follows up when an answer is vague, and Pulse groups the answers into themes with each quote traced to its transcript. The owner gets reasons that the review can check. Your team's time goes to the decision: whether to fund the fix, and where.
For a churn version of the same method, see how voice interviews find churn reasons a survey misses. Before your next review, write an owner and a threshold next to every metric on the dashboard. To see how a follow-up study would run, book a demo.
CSAT stands for customer satisfaction score. It asks a customer to rate one interaction, purchase or step, usually right after it happens. It is most often reported as the share of positive ratings. It is the right metric for fixing one touchpoint and a weak one for predicting renewal.
It is measured in three ways. Short surveys sent right after an interaction give CSAT and CES. Relationship surveys sent every few months give NPS. Account and sales data give retention, churn and repeat purchase. Interviews then explain the movements those numbers show. The guide to customer research methods covers each way of collecting it.
Churn is counted after a customer has left, so it arrives too late to keep that account. Satisfaction and effort scores are collected while the customer is still active. They show you which segment to look at first. Use churn for revenue decisions, and attitude scores as the early warning.
The four most often named are CSAT, NPS, CES and customer retention rate. The first three record what customers say. Retention records what they did. None is enough alone, so pair at least one attitude score with one behavior measure on a leadership dashboard.
Concept test results overstate demand when a yes costs the respondent nothing. How to read them, what to check before launch, and what to ask after.
How do AI interviews work in customer research? Follow one session from screener to follow-up question to a theme traced to its transcript.
Jobs to be done research gets harder when one account has many roles and business units. How to recruit, interview and merge jobs across them.