How to choose a sampling method for customer research
Choose a sampling method by the claim your customer study has to support, with a decision table for probability and non-probability sampling.
A representative sample of 20 interviews covers the segments a decision turns on. See what that lets you claim, and what only a survey can.
Imagine your bank wants to know why customers are moving from a premium credit card to a cheaper one. You talk to 20 of them and share what you found. Then your manager asks, "But is this representative?" So, what does that mean for just 20 people?
The answer depends on what you want to claim. If you want to claim what share of customers feel a certain way, you need a survey whose sample matches the mix of all your customers. If you want to explain why customers move to a cheaper card, you need 20 interviews that include every group whose reasons might differ.
A small group that fairly stands in for a bigger one is called a representative sample. In a survey, that means matching the mix. In 20 interviews, it means leaving no important group out.
When your manager asks if 20 interviews are representative, they may be thinking of a poll. In a poll, the sample's mix matches the bigger group on the traits that matter, so its percentages apply to everyone. That bigger group, such as all your cardholders, is called the population.
In 20 interviews, representative means something else. It means no group that would answer differently is missing.
Think of a pot of soup. One spoonful from a well-stirred pot tells you how salty the whole pot is. That's what a survey does. Twenty interviews are more like tasting each ingredient on its own. You learn what each one adds, but not how much of it is in the pot.
So why can't 20 interviews work like a small survey? A survey's numbers rest on a random draw. Random sampling gives everyone in the population a known chance of being picked. A survey also needs enough answers to estimate a share. Twenty interviews meet neither test.
Even a random 20 from a large customer base could easily miss a small group. That's why interviews aim to cover every group instead.
Two different things decide how far you can trust a sample.
The margin of error belongs to surveys picked at random. It doesn't apply to interviews, because interviews don't estimate shares.
Here is how each kind of sample is built, and what it lets your report claim.
| 20 interviews | A survey picked at random | |
|---|---|---|
| Representative means | Every group that could change the decision is covered | The sample matches the population on the traits that matter |
| You get it by | A written plan for which groups to cover, and a screener that checks each person fits | A random draw, then adjusting the answers so the mix matches the population |
| It can claim | Reasons, and how groups differ | Shares of the population |
| It can't claim | Any percentage, or which reason is most common | Reasons the questionnaire didn't offer |
| Margin of error | Doesn't apply | Comes from the random draw |
The random draw, more than the size, is what makes a survey's numbers worth trusting. Pew Research Center, a US research organization, runs its own polls that way. In a May 2026 Q&A, Pew said it does not use opt-in surveys, which take whoever answers an online ad or link. It uses probability-based sampling instead, picking real people in real life rather than online.
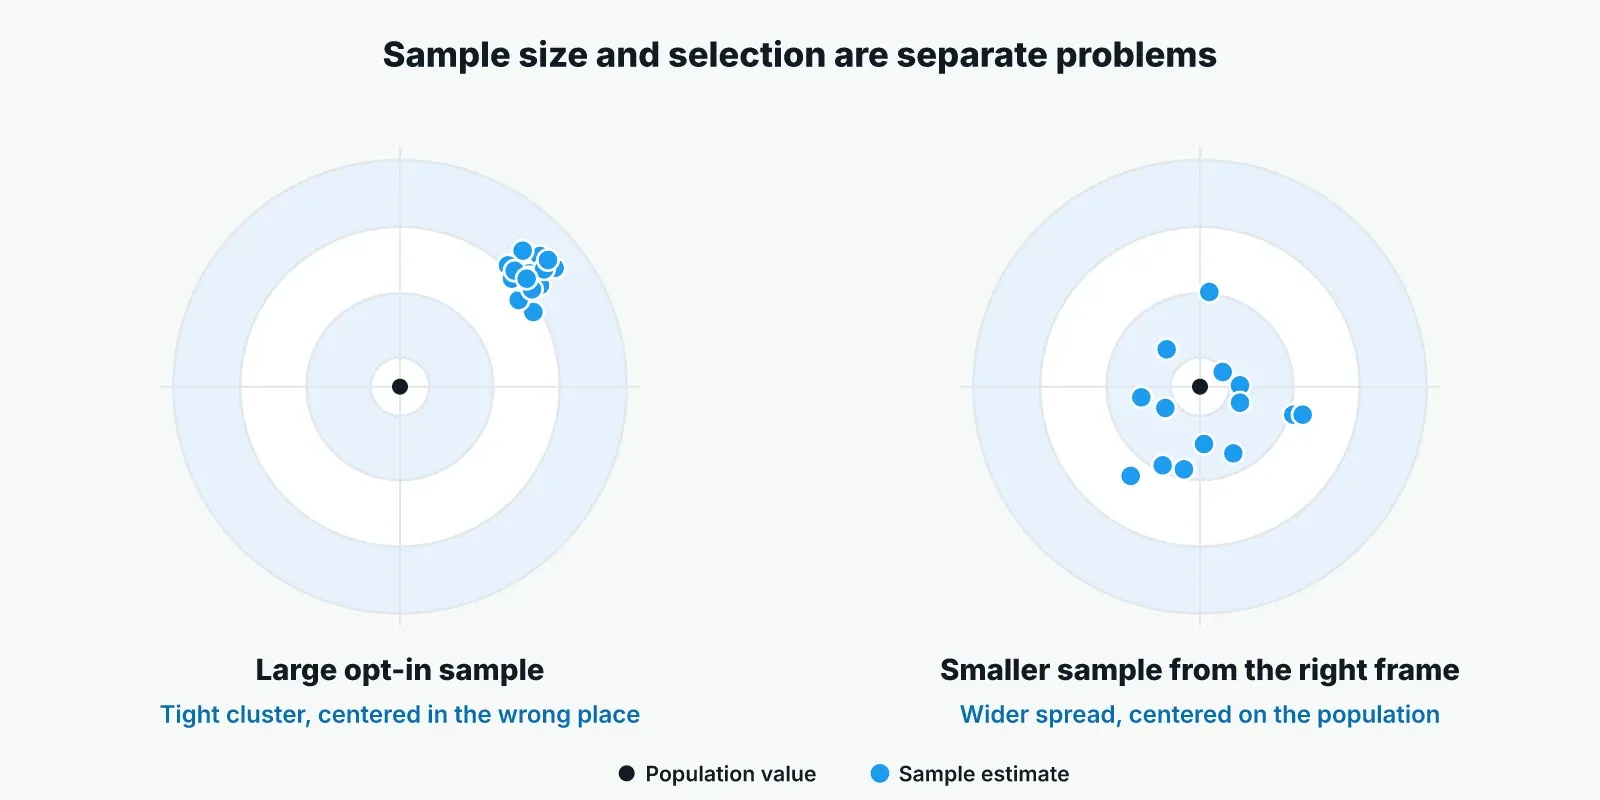
It's tempting to think more answers will make up for picking the wrong people. More answers do smooth out the chance ups and downs of picking any small group. But they do nothing about who was picked.
So a big sample from the wrong source just gives you the same wrong answer, with more confidence.
Say your bathroom scale always shows about 1 kg less than your real weight. Weigh yourself 100 times and you get the same wrong number every time.
Online surveys can have their own faulty scale, and it comes from who answers. Some people who answer surveys aren't honest, often because they want the reward. Pew calls them bogus respondents.
In an August 2026 methods appendix, Pew Research Center wrote that bogus respondents in opt-in samples can lead to large survey errors. The errors are biggest on questions about rare attitudes and behaviors.
Pew's March 2024 analysis of online opt-in polls gives a memorable example from a February 2022 survey experiment. Opt-in respondents under 30, and those who said they were Hispanic, were far more likely than others to claim a license to operate a nuclear submarine. Pew notes that the real share of Americans with that license rounds to zero.
Pew wrote that this kind of false claim can make results for those groups unreliable. The same problem can reach interviews.
Say the people recruited for your interviews aren't checked. Some fit the screener on paper only, and each one takes a place a real customer should have had. In a small study, that hurts a lot, because one bad interview is one twentieth of your evidence.
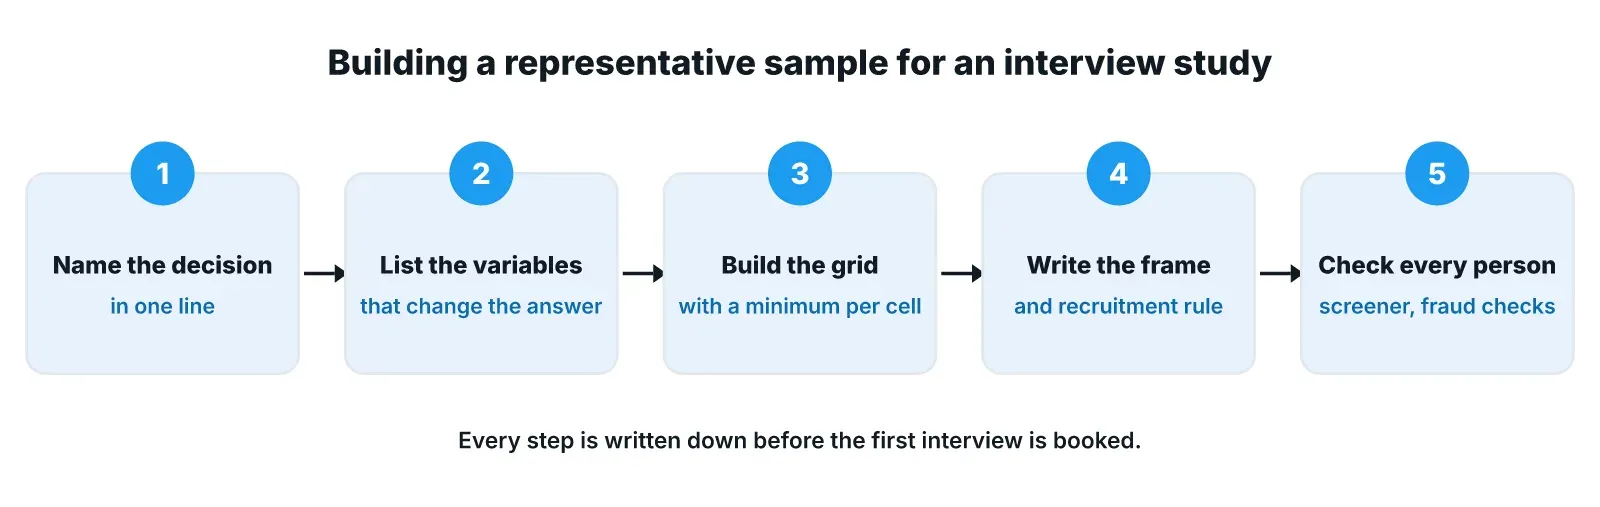
You can't make 20 interviews representative after they're done. The work happens before anyone is invited. Write each step down, because a written plan lets anyone check who was picked and why.
Write the decision in one line. Until you know what the study must decide, you can't tell which customers matter.
For the bank, the decision is "which offer to pay for to keep premium cardholders." That points to different customers than "which country to launch in first."
A trait is anything about a customer that might change what they tell you. Common ones are the product they use, how long they've been a customer, how they deal with you (online or in a branch), the country they live in, their language and how much they spend.
Keep a trait only if you can explain how answers might differ across it. Every trait you keep adds groups you'll have to fill.
Twenty interviews can't cover every trait. So pick the two or three that matter most and combine them into a grid. Each box in the grid is one mix of traits, such as newer customers in one country.
Then set a minimum number of interviews for each box, so no group goes missing by chance. That minimum is called a quota.
This borrows an idea from stratified sampling, which splits a population into groups and picks from each one. The difference is that nobody is picked at random here. The grid sets the groups, and the screener fills them.
The minimum per box is about coverage. The total number of interviews a study needs is a separate question, covered in how many interviews a study needs.
The list you invite people from shapes who you hear from. That list is called the sample frame.
It might be a download from your customer database, a group of customers who agreed to take part in research, or people found by a recruiting service. Write down which one you used, what the screener asks and how people were invited.
Also note who said no or dropped out. If one group keeps saying no, your report has to say so.
Check each person against the screener, and check for fraud, before their interview counts toward a box in the grid. If you skip this, the grid can show a group as covered when no one from it really took part.
Back to the bank. It wants to know why premium cardholders move to a standard card, because the answer decides which offer it pays for to keep them. Its research team has time for about 20 interviews.
The team has three options, and each one tells it something different.
| Option | What it can tell you | What it can't tell you |
|---|---|---|
| 20 cardholders picked at random | Reasons from whoever happened to be picked | Whether a small group, such as newer cardholders in one country, is covered at all |
| 20 cardholders picked from a grid | Reasons from every group the decision depends on, and how they differ | How many cardholders hold each reason |
| A survey of all the bank's cardholders | How many cardholders pick each listed reason | Reasons the questionnaire didn't list |
The bank can't list the reasons yet, so a survey would only count guesses. A random 20 could miss a whole group. So the team uses a grid.
It builds the grid from three traits: two countries, two lengths of time as a customer, and whether people moved to a cheaper card or kept their premium card. The numbers are interviews per box.
| Country | Time as a customer | Moved to a cheaper card | Kept the premium card |
|---|---|---|---|
| Country A | Under 3 years | 3 | 2 |
| Country A | 3 years or more | 3 | 2 |
| Country B | Under 3 years | 3 | 2 |
| Country B | 3 years or more | 3 | 2 |
Twelve interviews go to people who moved to a cheaper card, and eight to people who kept their premium card. The second group is there for comparison. If both groups give the same reason, that reason probably doesn't explain why people moved.
Then the team writes up what it found. Here is a claim that says too much, next to one the interviews can support.
| Too strong | About right |
|---|---|
| "Most customers who moved to a cheaper card did it because of the annual fee." | "Premium cardholders who moved to a cheaper card gave these reasons, and newer cardholders gave different reasons from long-time cardholders." |
The first claim is a share, and 20 interviews can't support it, however often the fee came up. So the report opens with two lines on who took part, how they were found and which boxes in the grid each finding rests on.
Each finding says what kind it is: a reason, a pattern or a difference between groups. It links to its quotes and notes which groups it didn't show up in. The guide to analyzing interview transcripts shows how to build themes that pass that check.
Say the bank then needs to know how many cardholders hold each reason. That's a share, so it would run a survey next. The survey would use the reasons from the interviews as its answer options, and go to cardholders picked at random from the full list. The sample size calculator works out how many answers that survey needs.
Before anyone books an interview, decide what your report must claim. That decides the kind of sample you need.
When someone asks if a sample is representative, the answer depends on steps they can't see: the screener, the recruiting, the fraud checks and the link from each finding back to its source. Each step needs a record the people deciding can open.
Pulse is built for those steps. It turns your research question into a brief with an audience and a screener. It then recruits participants to that profile or invites your own customers, with fraud checks on every participant.
Its AI-moderated voice interviews ask every person the same clear questions, and follow up when an answer is vague. Every theme links back to the transcripts it came from, and surveys run alongside the interviews when you need the count.
Your team still picks the traits that matter and decides what the findings mean. To see a study run from brief to report, book a demo.
These three questions come up most once the interviews are done.
A random sample is about how you pick: everyone in the population has a known chance of being picked. A representative sample is about the result: its mix matches the population on the traits that matter. Picking at random is the usual way to get a representative survey sample.
A sample is unrepresentative when a group that would answer differently is missing, or takes up far more of the sample than it should. Common causes are a list that leaves people out, a screener that is too strict, one group not answering, and fake participants.
In interviews, a missing group does more harm than an uneven mix, because you never hear that group's reasons at all. See what makes a sample unbiased.
No. Adjusting answers so the sample's mix matches the population is called weighting, and it only works when a study estimates shares. Interviews don't estimate shares, so there's nothing to adjust. If one group has too few interviews, add more interviews for that group instead.
Choose a sampling method by the claim your customer study has to support, with a decision table for probability and non-probability sampling.
Design and run questionnaires that answer a real decision: set the objective, pick a mode, order and pilot questions, then analyze the results.
Market sizing rests on guesses about who buys, who pays and who would switch. Here is how to test those guesses with customer interviews and a survey.