What a representative sample means for 20 interviews
A representative sample of 20 interviews covers the segments a decision turns on. See what that lets you claim, and what only a survey can.
Choose a sampling method by the claim your customer study has to support, with a decision table for probability and non-probability sampling.
Imagine your bank plans to introduce a new fee on credit cards. You want to know how many customers might stop using their cards and why. But asking every customer would take too much time. So, who should you ask?
The answer depends on what you want to learn. If you want to estimate how many customers might leave, you need a sample that represents all your customers. If you want to understand why they might leave, you need to hear from customers who can explain their reasons.
Picking who to ask is called sampling. To choose the right sampling method, start with three simple questions: What do you need to learn? Who can you reach? And do some groups need their own answer?
Each question narrows the next one, so it helps to answer them in order.
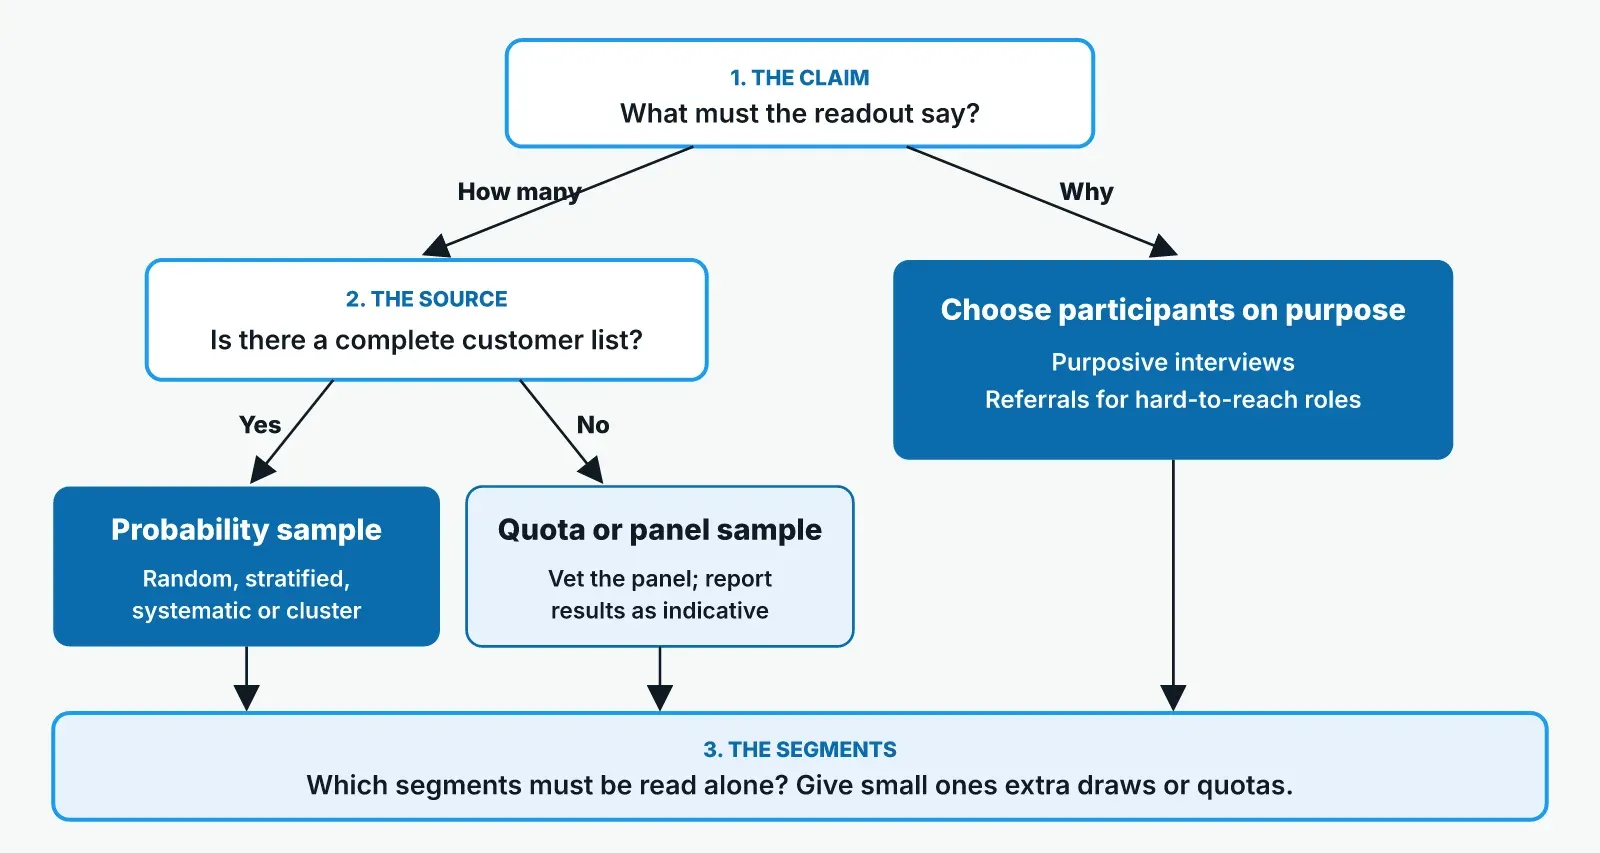
Go back to the bank. Your manager might ask, "What share of customers would leave?" That needs a number. Or your manager might ask, "Why would customers leave?" That needs reasons.
A number and a list of reasons need different samples.
For a number, everyone on your list needs a fair chance of being picked. Then the number you find stands for all your customers. This is called a probability sample. It also tells you how close your number is likely to be to the real one, a range called the margin of error.
For reasons, a random pick matters less. You want customers who have something to say, such as people who already cancelled their card or people who complained about fees.
You can only pick people from a list you have. That list is called your sample frame, and anyone who isn't on it can never be picked.
If your bank's customer database holds every cardholder, you can pick from all of them at random. Other lists leave people out. A list of customers who agreed to take surveys leaves out everyone who didn't agree. A list of customers your sales team knows leaves out everyone else.
So if your list leaves people out, your number only speaks for the people on the list.
Say only a few of your customers hold a premium card, and your manager wants a separate answer for them. If you pick at random from all customers, you might get only a handful of premium cardholders. That's too few to say anything about them.
So decide before you start how many people you need from each group, such as each card type or each country. Then pick extra people from the small groups.
Sampling methods come in two families. One helps you count, and the other helps you explain.
Probability methods give everyone on your list a fair, known chance of being picked. Use them when you need a number that stands for all your customers.
Non-probability methods let you choose who to ask. Use them when you need reasons. They can't give you a number that stands for all your customers.
If you have a full list of customers, there are four common ways to pick from it at random.
When you choose who to ask, four methods are common.
The difference matters most when you write up what you found. Say you talked to customers who cancelled, and most of them mentioned fees. Here are two ways to report it.
Before: "Most customers who cancel do so because of fees."
After: "Among the customers we talked to who cancelled, fees came up most."
The first sentence talks about all customers, and your interviews can't show that. The second says what you found, and among whom.
This decision table matches each question to a sampling method. Each row starts with a question a team might ask, then shows the method that fits and the mistake to watch for.
| Your question | Method that fits | Watch out for |
|---|---|---|
| How happy are all our customers? | Simple random, from a full customer list | Customers missing from the list, such as those who joined through a partner |
| How happy are customers with each card type? | Stratified, with extra people from small groups | Before you give one overall number, adjust each group back to its real size |
| How do customers rate our support? | Systematic, every 20th closed support request | A list sorted by support agent can put every pick on one agent |
| How do customers find our branches? | Cluster, whole branches first | Customers of one branch tend to be alike, so each answer tells you less |
| Why did customers leave last quarter? | Purposive interviews with people who left and people who stayed | Reporting percentages the interviews can't support |
| What do people think of a new idea? | Quota or convenience, as a first look | Treating it as the view of all customers |
| How does a company decide what to buy? | Purposive, then snowball | Every suggestion coming from one circle, so start from several people |
| How do people see our brand each month? | A panel picked at random | How good the panel is, and how it removes fake answers |
Many of these questions work best as a pair: a survey to count, and interviews to explain. Our post on qualitative and quantitative research covers how the two fit together.
Say you design a careful survey and buy answers from an online panel, a group of people who signed up to take surveys. If many of them don't answer honestly, your careful design still gives you wrong results. It's like a good recipe made with stale ingredients.
Many quick surveys use opt-in panels, which anyone can join. Two things decide how far you can trust them: who is in the panel, and how it removes fake answers. Fake answers here means answers from people who aren't honest or aren't paying attention.
Pew Research Center tested this in an online opt-in survey of 11,114 US adults, run on Nov 14-19, 2024. It tried three ways to remove fake answers: trap questions, a paid screening service, and checking people against public voter records.
In its August 2026 report on that survey of 11,114 adults, Pew found that removing fake answers made most results more accurate. But checking people against voter records made results slightly less accurate, because it removed mostly honest people.
A March 2024 Pew Research Center analysis compared three online opt-in samples with three panels picked at random. Young and Hispanic people in the opt-in samples were much more likely to answer "yes" to 10 or more of 16 yes/no questions. Very few people in the random panels did that.
How a panel picks its people matters too. A 2024 review in the Oxford Research Encyclopedia of Criminology found that panels with more careful ways of picking people tend to give more accurate results.
Before your survey goes out, ask the panel company three questions. Each answer tells you how far to trust what comes back.
If you have a full list of your own customers, it's often the better place to start, because you already know who is on it.
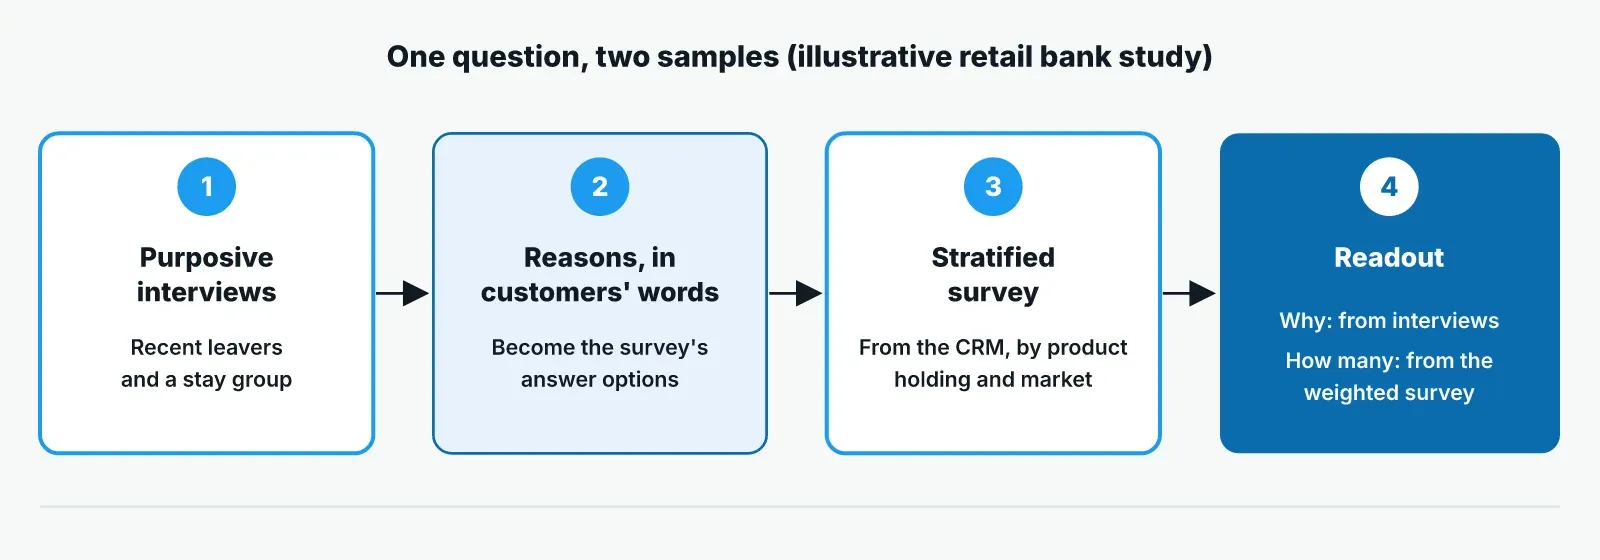
Back to the bank and the new credit card fee. The bank needs to know how many customers would leave, and why. Those are two questions, so it needs two samples.
The bank has four options. Each one can show some things about its customers, but not others.
| Option | What it can show | What it can't show |
|---|---|---|
| A survey of an online opt-in panel | Quick reactions from people who look like customers | What the bank's own customers would do |
| A stratified survey picked from the customer database | An estimated share of each card type who say they would leave | Why they would leave |
| Interviews with customers who recently left and customers who stayed | Their reasons, in their own words | How common each reason is |
| Chats with customers in a branch | First impressions | Anything about customers who rarely visit a branch |
The customer database holds every cardholder, so the bank can pick at random from it. The panel adds nothing here.
First, the bank interviews. It talks to customers who recently cancelled their card, and to similar customers who stayed. The interviews bring out reasons such as the size of the fee, a better card elsewhere, or rarely using the card at all.
Next, those reasons become the answer options in the survey.
Then the survey counts. The bank picks at random within each card type, with extra people from the small premium group. It adjusts the premium answers back to the group's real size before giving one overall number.
Now the bank can say what share of customers would leave, with a margin of error, and why. The interviews also show what would change customers' minds, such as ways to avoid the fee. So the bank can decide how to design the fee, as well as whether to charge it.
Start from what you need to learn. If you need a number and you have a full list of customers, pick people at random from that list.
If you need reasons, pick people who can explain them, and report what you found among those people only.
If you need both, interview first and count second.
Once you've picked a method, you need the right people for both parts of the study. Pulse turns your question into a research plan, including who to talk to and a screener, a short quiz that checks each person fits the study.
It invites your own customers from a list you share, or recruits participants to match that profile. Every participant goes through fraud checks.
For the "why" part, an AI moderator runs voice interviews and asks a follow-up question when an answer is vague. Themes come back with quotes, each linked to its transcript.
For the "how many" part, surveys run alongside the interviews, so their answer options can come from what people said.
To see how both samples would run for your next study, book a demo.
Once you've picked a method, most questions are about numbers and shortcuts.
They are simple random, stratified, systematic and cluster sampling. All four give everyone on your list a known chance of being picked, so you can report a number with a margin of error.
They differ in how they pick: from one pool, from each group, at a fixed gap, or whole groups at once.
Asking every customer takes too long and costs too much, and many customers won't answer. So even if you ask everyone, you end up with a sample: the customers who replied.
A random sample from a full list is faster and cheaper, and you know how far off it might be.
For a survey, it depends on how exact each group's number must be. A smaller margin of error needs more people, and the sample size calculator works it out for you.
For interviews, there's no set number. Keep going while new interviews still teach you new reasons, then say how many you ran.
Only partly. A quota sample matches your customers on the traits you set, such as country or age. It can't match them on anything else, because each group fills with whoever comes first.
So treat its numbers as rough guides, and say so when you report them.
A representative sample of 20 interviews covers the segments a decision turns on. See what that lets you claim, and what only a survey can.
Design and run questionnaires that answer a real decision: set the objective, pick a mode, order and pilot questions, then analyze the results.
Market sizing rests on guesses about who buys, who pays and who would switch. Here is how to test those guesses with customer interviews and a survey.