How to choose a sampling method for customer research
Choose a sampling method by the claim your customer study has to support, with a decision table for probability and non-probability sampling.
Market sizing rests on guesses about who buys, who pays and who would switch. Here is how to test those guesses with customer interviews and a survey.

A strategy team takes its market sizing to the steering committee, and the first challenge is an adoption rate nobody checked. Market sizing estimates how much a market could spend on what you sell. Public data gives the total. Your share rests on four guesses about buyers, so test them with customers before the number reaches a business case.
Get one guess wrong and the plan is wrong with it. A product line gets funded for buyers who only shop every few years, or a sales team is sent to people who do not hold the budget.
The steps below show which numbers need customer evidence, and how to collect it in one study.
Market sizing produces three numbers, each smaller than the last. The total addressable market (TAM) is everyone who could buy. The serviceable addressable market (SAM) is the part you can reach. The serviceable obtainable market (SOM) is the part you can win in a set time. Each step down rests on a guess about buyers.
| Layer | What it counts | The guess behind it |
|---|---|---|
| TAM | Every buyer who could use the category | Who counts as a buyer at all |
| SAM | The buyers your product and sales teams can reach | Which segments, countries and budget holders you can reach |
| SOM | The share of the SAM you can win in a set period | How many buyers adopt, how fast they switch, and when they can buy |
There are two ways to build these numbers. Top-down sizing starts big and cuts down. A team sizing a compliance product takes every regional bank in a country, then filters by fit and reach. Bottom-up sizing starts small and builds up. The same team lists the banks its sales team can name, multiplies by a license price, then by how often banks renew.
Both rest on the same guesses about buyers. Top-down hides them inside its filters. Bottom-up puts each in its own cell, where a reviewer can question it and customers can test it.
The total market rarely decides whether a project gets funded. Your share does, and that share rests on four guesses: what makes a buyer start looking, who pays, what would make them switch, and how often they buy. Public data gives you an average for each. The reasons behind those averages come from buyers.
| Guess | What public data gives you | What buyers tell you |
|---|---|---|
| When buyers start looking | How many companies use the category today | The event that starts a search |
| Who pays | Average spend per company | Who signs off, and from which budget |
| What makes them switch | Each provider's current share | What would have to be true to leave the current option |
| How often they buy | Industry purchase averages | Their real buying and renewal cycle |
Some buyers look for a new supplier only when something forces it. For illustration, a retailer's finance team may review its card processor only when the contract is up for renewal. If contracts run for years, only a slice of the market is shopping in any one year, and that slice caps your first-year share. Ask "What happened the last time you started looking for something like this?"
The same company can sit inside or outside your serviceable market depending on whose budget pays. A scheduling tool sold to operations teams has a smaller SAM than the filter suggests if large companies pay from the IT budget and your sales team never meets IT. Ask "Who approved the last purchase, and whose budget did it come from?"
A buyer who likes your product may still stay put, because switching costs time, retraining and risk. A model that assumes buyers move as soon as they see a better option overstates your share. Ask "What would have to be true for you to replace what you use now?" Then ask what stopped them the last time they looked.
A yearly subscription and a five-year contract give very different yearly revenue from the same buyers. Industry averages blur that. Ask buyers when they last bought, and when they bought before that.
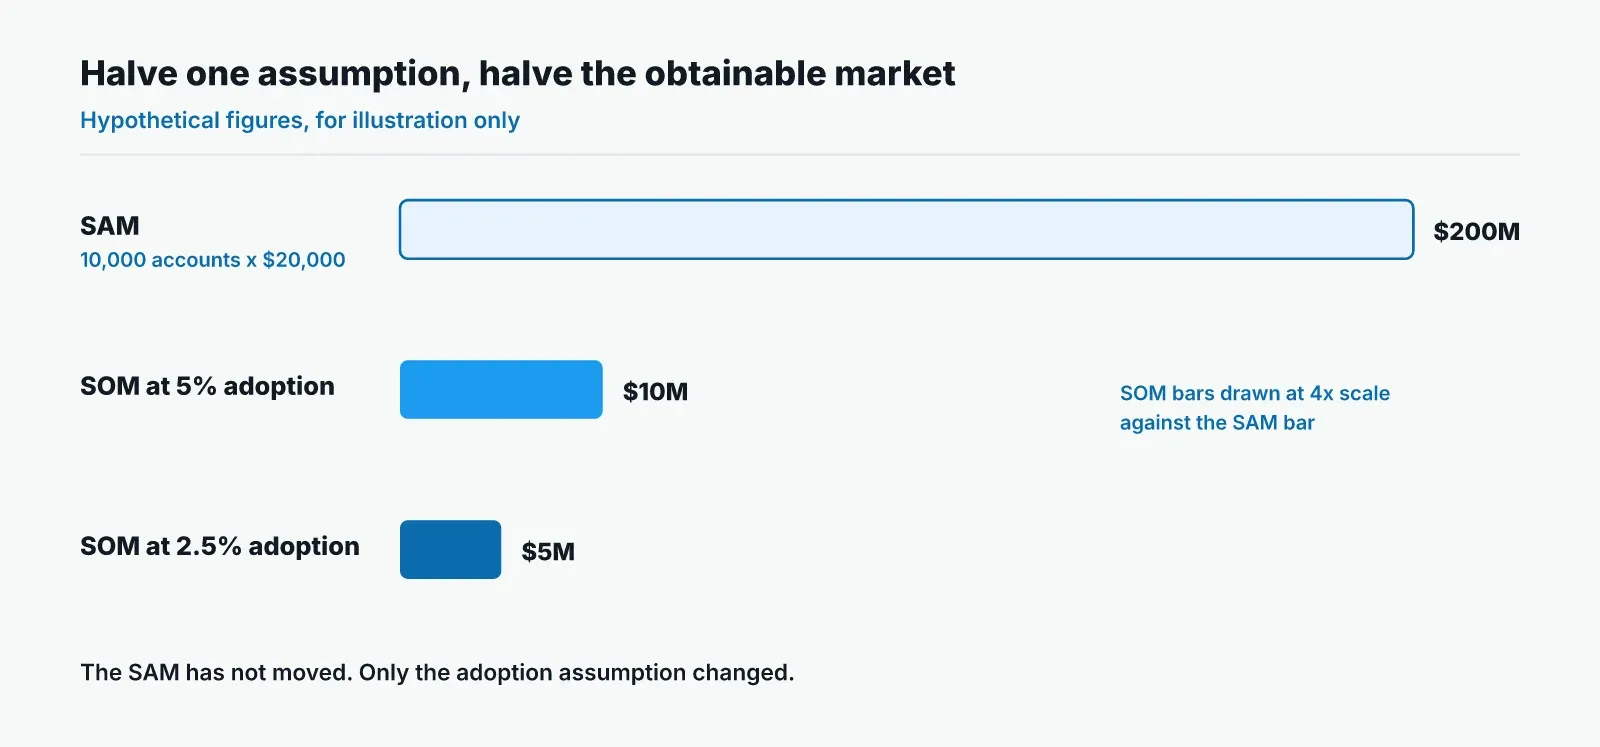
For illustration, take a serviceable market of 10,000 companies, each spending $20,000 a year. That is $200 million. If 5% adopt in year one, the obtainable market is $10 million. Halve the adoption guess to 2.5% and it falls to $5 million. The total and the serviceable market have not moved.
Before any fieldwork, halve each guess in turn. The ones that change the funding decision are the ones customers need to confirm.
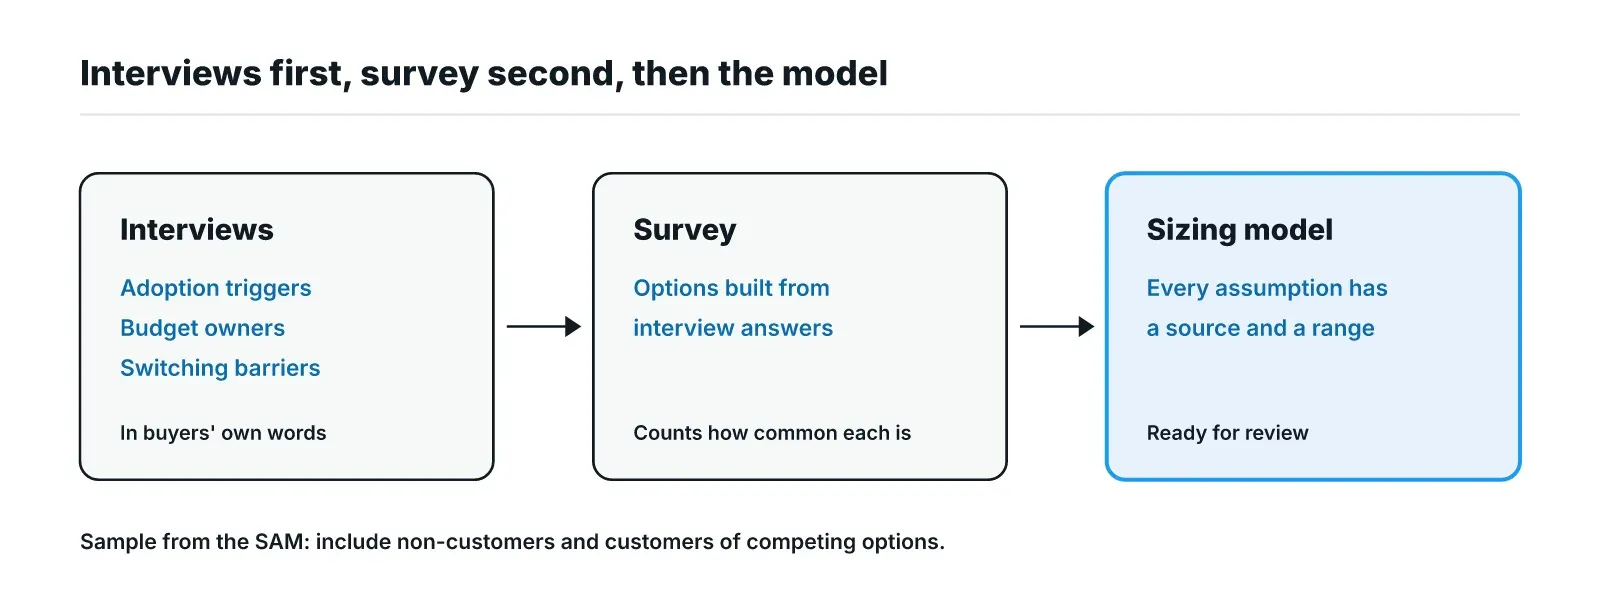
Run interviews first and a survey second. The interviews find the reasons in buyers' own words: what started their search, who paid, what stopped them switching. The survey then counts how common each reason is across the market. Together they give every guess in your model a source and a share.
For when each kind of evidence fits, see the difference between primary and secondary research.
Turn every guess into a plain statement. "Mid-size merchants switch processors when a cheaper offer arrives" can be tested. "There is demand in this segment" cannot. A testable guess tells the interviewer what to ask, and later shows the steering committee what was checked.
Draw people from the serviceable market you are sizing. Include customers of rival options, and people who looked at a product like yours and did not buy. Your own customers can tell you why people buy. Only the people who did not buy can tell you why. The list you recruit from is your sample frame, and it should match the market in the model.
Ask what buyers did, because a past purchase can be checked against records and compared across people. A forecast of their own buying cannot.
| Instead of asking | Ask |
|---|---|
| Would you buy this? | Tell me about the last time you bought something to solve this problem. What did you pay, and who approved it? |
| Would you switch? | When did you last look at other options, and what happened? |
| How much would you spend? | What did you spend on this last year, and from which budget? |
When a buyer says "we'd probably switch", ask what stopped them last time. The answer can name a switching cost your model has not priced. For more on question craft, see writing interview questions that get behavior, not opinions.
Write the survey's answer options from the triggers, budget owners and switching reasons buyers named in the interviews. Options written from your team's own beliefs hand those beliefs back to you, which is what a fixed questionnaire cannot capture.
Before the readout, put each finding next to the input it informs. Mark whether the evidence supports the guess, narrows its range or contradicts it. Deal with contradictions first, because each one changes the number. Keep the quote behind each change, so the model shows where every input came from.
Illustrative example: a payments company is deciding whether to build a product for mid-size merchants in a second country. Its top-down model counts merchants in each country, applies an average spend, and assumes the same adoption rate in both. Customer research tests whether that last assumption holds, and what it would change.
The team has four options.
| Option | What it can establish | What it cannot establish |
|---|---|---|
| Desk research and the current model | How many merchants exist and what they spend on average | When they shop for a new provider, or who pays |
| A survey on its own | How common each listed answer is | Reasons the team did not think to list |
| Interviews on their own | The triggers, budget owners and switching barriers, in merchants' words | How common each one is across a country |
| Interviews, then a survey | The reasons, and how common each is in both countries | Future behavior, which stays a forecast |
The team chooses interviews, then a survey. Suppose the interviews in both countries show the same trigger: merchants look at new providers only when their processor contract comes up for renewal. Suppose they also show that the budget sits with operations in the first country, where the company already sells, and with finance in the second.
That changes the model in two places. The obtainable market each year shrinks to merchants who are renewing. And the second country needs a sales channel that reaches finance teams, which the business case must now cost.
The survey then counts how many merchants in each country share that trigger and budget owner, with the same questions in both. The business case goes to the steering committee with a range for each country, and each guess names its source.
The decision on the table becomes whether to fund a finance-facing sales team in the second country before building the product there.
Pulse fits the interview-then-survey study this method needs. It turns your four guesses into a study brief with an audience and screener, runs AI-moderated voice interviews with follow-up questions when an answer is thin, and runs surveys alongside the interviews. Every theme links back to the transcripts it came from.
When someone in the steering committee challenges the adoption guess, the team can open the interviews behind it. A sizing study across countries can run as one study across several markets, with the same questions in each. Pulse runs the fieldwork and the first synthesis, so the team's time goes to deciding what the business case should say.
Your next step is the halving test on your own model. Take the guesses that change the funding decision to buyers, and label the rest as public data. To see how that study would run, book a Pulse demo.
Use both, and compare the results. Top-down gives a quick ceiling from public data. Bottom-up shows each guess about buyers, price and buying cycle as its own number. When the two results are far apart, at least one guess differs between them, and that guess is the place to start your customer interviews.
There is no fixed number. It depends on how many segments and countries you are sizing, how different buyers are within each, and how many guesses you are testing. Here the interviews find the reasons and the survey does the counting, so plan interviews for each segment separately.
Stop adding interviews in a segment when new conversations stop adding new reasons. For more, see how many user interviews you really need.
Ask about the problem and leave the product out. Buyers cannot describe a past purchase of something new. They can describe how they handle the problem today, what that costs, who pays, and what made them try their current fix. That spend and that trigger can be checked against records.
Update it when one of the four guesses changes. A new regulation can create a reason to buy, a large rival can change its contract terms, or the budget can move to a different team. Each shifts the share you can win while the total stays the same. Interview buyers again on the guess that moved.
Choose a sampling method by the claim your customer study has to support, with a decision table for probability and non-probability sampling.
A representative sample of 20 interviews covers the segments a decision turns on. See what that lets you claim, and what only a survey can.
Design and run questionnaires that answer a real decision: set the objective, pick a mode, order and pilot questions, then analyze the results.