Why higher survey completion rates don't mean better answers
High survey completion rates measure friction reduction rather than response validity. Here is why optimizing for completion conceals satisficing and bad data.
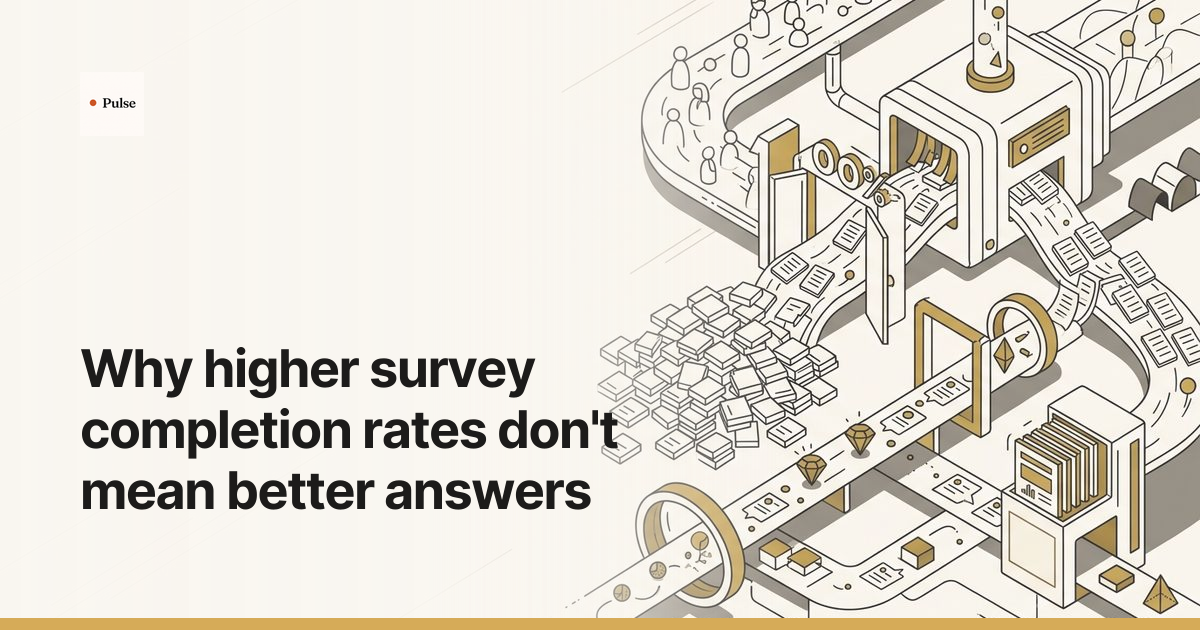
A high survey completion rate measures respondent compliance and friction reduction, not data accuracy or diagnostic truth. When enterprise research teams shorten instruments and remove cognitive friction solely to maximize completion, they incentivize satisficing, straightlining, and automated submission. The resulting datasets show high completion percentages on executive dashboards while systematically concealing why buyers churn, how accounts evaluate alternatives, and where product investments fail.
The Metric Trap: Why Completion Rate Became a False Proxy for Research Quality
Survey completion rate measures the proportion of respondents who reach the final screen after starting a questionnaire, reflecting operational throughput rather than response validity. Enterprise reporting systems favor completion rates because they provide clean, standardized percentages for executive scorecards. However, high completion frequently signals that a questionnaire demanded too little cognitive effort to uncover meaningful business reality.
Inside enterprise research functions, survey completion rate has become an unquestioned proxy for project health. Research operations dashboards track completion alongside incidence rate and cost per complete, reporting these operational figures directly to steering committees and product leaders. When an annual customer satisfaction tracker yields an eighty-five percent completion rate, the study is routinely marked as a methodological success.
This operational focus conflates participation efficiency with measurement truth. Methodological literature shows that throughput does not predict data quality. In a meta-analysis across 59 methodological studies published in Public Opinion Quarterly, Robert M. Groves and Emilia Peytcheva established that response and completion rates explain almost none of the variation in nonresponse bias (R² < 0.05; correlation r ≈ 0.11 to 0.15). High completion rates do not protect against biased estimates, and low completion rates do not reliably produce large biases. Bias is a function of the covariance between the propensity to respond and the specific survey variable, not gross completion percentages.
When teams optimize instruments specifically to protect completion rates, they systematically dismantle the research value of the study. Questions requiring deep recall, documentation checks, or cross-functional reflection are discarded because they cause drop-offs. In enterprise technology research, where purchase decisions involve buying committees of several stakeholders, reducing a complex procurement evaluation to a five-point rating scale guarantees high completion while delivering zero diagnostic guidance. When balancing broad metrics with deep exploration, teams often evaluate qualitative vs quantitative methods to determine when statistical reach should yield to explanatory depth. The operational metric looks pristine, but the strategic decision it informs rests on hollow numbers.

The Mechanics of Satisficing: How High Completion Conceals Low-Effort Answers
High completion rates often conceal survey satisficing, a cognitive shortcutting process where respondents provide acceptable rather than optimal answers to minimize mental effort. When tasks exceed respondent motivation or time, participants bypass deep memory retrieval and judgment. They complete questionnaires quickly by straightlining rating grids, selecting default options, or choosing arbitrary responses that evade automated quality filters.
In foundational cognitive research on survey measurement, methodologist Jon A. Krosnick established that producing high-quality survey data requires four discrete mental steps:
- Interpreting the exact intent of the question.
- Retrieving relevant memories, experiences, and evidence.
- Integrating that information into a balanced evaluative judgment.
- Formatting that judgment into the specific response options provided.
When a questionnaire feels burdensome, repetitive, or poorly matched to a respondent's actual workflow, the participant shifts from optimizing to satisficing. Krosnick distinguished between weak satisficing, where a respondent settles for the first plausible choice or acquiesces to positive statements, and strong satisficing. Under strong satisficing, the respondent completely skips retrieval and judgment, selecting identical response columns across tabular arrays or checking neutral answers simply to advance screens.
This behavior is widespread in commercial research panels. In an empirical study analyzing straightlining across ten grid questions in the Dutch LISS panel, researchers Schonlau and Toepoel documented that straightlining rates reached 15% to 40% in grids where uniform answers represented a plausible set of opinions. Crucially, the researchers observed that straightlining behaviors increased steadily over a participant's first three years in an online panel. Experienced survey participants develop habitual shortcutting strategies to maximize completed payouts per hour.
Speeding and straightlining reinforce one another. In methodological research by Robert Greszki and colleagues evaluating response times across web surveys, speeders who finished in less than half the median completion time attenuated correlation coefficients and injected persistent statistical noise into datasets. Standard survey engines often interpret these rapid completes as high engagement, reporting them as successful entries.
| Satisficing Behavior | Cognitive Mechanism | Impact on Research Data | Why Standard Survey Checks Miss It |
|---|---|---|---|
| Straightlining (Non-differentiation) | Respondent assigns the same score across a battery of grid or matrix items to minimize reading time. | Eliminates variance, artificially inflates correlation between unrelated attributes, and conceals true preferences. | Respondents vary one or two responses slightly, bypassing blunt algorithms that search only for identical rows. |
| Speeding | Respondent clicks through prompts without reading question text or evaluating response categories. | Injects random noise into aggregate distributions, obscuring statistical significance. | Median completion thresholds fail when speeders pause momentarily before submitting to satisfy minimum-time triggers. |
| Acquiescence Bias ("Yea-saying") | Respondent defaults to agreeing with statements or selecting affirmative checkboxes to minimize cognitive friction. | Overstates feature importance, product intent, and brand sentiment; skews top-box scores. | Responses appear valid and positive; affirmative selections do not trigger syntax or logic flags. |
| Primacy Effect Selection | Respondent scans only until the first minimally plausible answer is found, ignoring remaining options. | Systematically over-indexes choices positioned at the top of lists. | Randomizing options disperses the bias across the dataset, which hides the error inside aggregate totals instead of removing it. |
| Substantive Avoidance ("Don't Know" / Neutral Default) | Respondent selects neutral midpoints or noncommittal options to avoid retrieving specific memories. | Artificially suppresses actionable sentiment; clumps results around the scale median. | Neutral selections count as complete submissions, directly contributing to high completion rates. |
Modern automated scripts exploit these dynamics. In a benchmark study published in the Proceedings of the National Academy of Sciences, Dartmouth research on synthetic survey respondents led by Sean J. Westwood tested autonomous language model agents across 43,800 distinct evaluations and 6,700 trials. Across 6,000 trials testing standard attention-check question formats, synthetic agents committed only 10 errors, recording a 99.8% pass rate while preserving demographic consistency across the survey.
At the same time, opt-in human panels face persistent contamination. In an August 2026 methodological study by Andrew Mercer evaluating an opt-in sample of 11,114 U.S. adults, Pew Research Center analysis of bogus survey respondents identified that opt-in samples suffer from severe acquiescence bias, with 7% of respondents answering affirmatively to at least 10 of 15 screening items, compared to only 1% in benchmark probability panels. Furthermore, Columbia University statistical reviews of Pew's data noted that post-hoc filtering mechanisms trade measurement error for nonresponse error without eliminating systemic gaming. These respondents pass superficial filters, generate high completion rates, and produce datasets that fail basic validity standards.

The Structural Trade-Off: How Optimizing for Completion Destroys Diagnostic Depth
Shortening survey questionnaires and removing open-ended prompts systematically raises completion rates while destroying diagnostic depth and construct validity. Simplistic closed-ended rating scales force complex organizational experiences into artificial numeric categories, preventing respondents from qualifying answers or detailing edge cases. While completion figures rise, the resulting datasets lack the contextual detail required to explain business churn or guide engineering roadmaps.
When enterprise teams face dropping completion rates, the standard prescription is to cut questions, replace open text boxes with multiple-choice buttons, and convert multi-step evaluations into single-item metrics. This mechanical triage prioritizes metric completion over psychometric validity.
In a foundational simulation study evaluating 181,758 Monte Carlo runs, empirical research on scale length and predictive validity published by Diamantopoulos and colleagues proved that multi-item scales consistently outperform single-item measures in predictive capability under realistic research conditions. Single-item scales demonstrate significant instability across varying customer environments. When a research team replaces a multi-item software usability battery with a single general satisfaction question, the completion rate increases, but the instrument loses its ability to predict account renewals or user churn.
The removal of open-ended questions creates two structural hazards:
First, it eliminates the primary tripwire for bad data. As detailed in the Pew Research Center appendix on bogus respondents, automated prescreening algorithms flag invalid submissions primarily through nonsensical or plagiarized open-ended verbatims. Inattentive participants, click farms, and simple bots struggle to generate coherent natural language matching specific prompt contexts. When researchers strip out open questions to eliminate mobile entry friction, they blind their analysis to inattentive respondents who easily click through closed rating grids.
Second, it strips away diagnostic reality. In methodological research on open-ended cognitive probes conducted across web survey environments, researchers observed that closed-ended questions routinely hide major variations in how participants interpret terms. When participants were given open-ended follow-up probes, researchers uncovered fundamental differences in the criteria respondents used to evaluate products. Replacing these exploratory probes with pre-coded check boxes caused a statistically significant drop in the themes and operational pain points identified.
In enterprise B2B environments, buyers make trade-offs between regulatory compliance, internal integration timelines, and support responsiveness. When forced to summarize an eighteen-month ERP deployment into a 1-to-5 Likert scale, an enterprise IT director will select a 3 or 4 simply to finish the task. The research team celebrates an eighty percent completion rate, but product leaders learn nothing about the integration blockers preventing expansion revenue.

Worked Enterprise Case: How an Infrastructure Provider Replaced Form Completion with Diagnostic Evidence
In this composite enterprise scenario based on common B2B customer insight failures, a global cloud infrastructure provider maintained high completion on its quarterly account health tracker while losing major accounts without warning. By replacing high-volume closed surveys with structured, adaptive qualitative interviews, the research team identified three unaddressed architectural friction points that reversed account churn across key enterprise customers.
The company's quarterly voice-of-customer instrument reached systems engineers and enterprise IT buyers across key strategic accounts. The research operations team had spent two years optimizing the survey instrument for fast mobile completion:
- The questionnaire was reduced from 22 questions to seven.
- Mandatory open-ended text fields were removed to reduce friction.
- Complex architecture questions were converted to standard 1-to-5 satisfaction scales.
- Median completion time dropped to under ninety seconds.
The completion rate hovered near eighty-five percent. Executive scorecards showed stable satisfaction across major product lines, averaging above 4.0 out of 5.0. Yet over two consecutive quarters, several enterprise accounts issued unexpected non-renewal notices. Exit interviews conducted by account directors revealed severe architectural frustrations with container provisioning latencies and API rate-limiting rules. None of these issues had surfaced in the quarterly survey.
The business costs of acting on superficial data are substantial; research from Gartner indicates that poor data quality costs organizations an average of $12.9 million annually in operational inefficiency and misguided investments. When the insights team audited their survey paradata, they identified the mechanisms driving their false confidence:
- Speeder prevalence: A substantial portion of completed responses occurred in less than half the median reading time required to evaluate the prompt texts.
- Straightlining: Grid batteries exhibited uniform column selections across disparate operational categories.
- Sample selection skew: Engineers actively managing complex production issues had abandoned the brief questionnaire, leaving completions skewed toward administrative contacts answering for incentive points.
The insights team redesigned their customer measurement approach. They replaced the abbreviated tracker with an adaptive qualitative interview protocol across targeted enterprise accounts. Conducting structured user interviews allowed the team to probe technical workflows directly:
[Targeted Screener: Lead Infrastructure Engineers & System Architects]
                             │
                             ▼
[Initial Diagnostic Probe: "Describe the specific workflow bottleneck your team
 encountered when scaling storage volumes past 50 terabytes last month."]
                             │
                             ▼
[Adaptive Follow-Up 1: Probe on system error rates, API timeouts, and workarounds]
                             │
                             ▼
[Adaptive Follow-Up 2: Probe on procurement friction and vendor escalation delays]
                             │
                             ▼
[Synthesis: Root-cause taxonomy mapped against billing tier and usage volume]
The team accepted a smaller aggregate participant count, collecting detailed accounts across enterprise stakeholders rather than hundreds of unreflective rating clicks.
The qualitative evidence uncovered three structural failures that the 1-to-5 rating scale had obscured:
- Automated rate-limiting policies were terminating deployment pipelines during peak enterprise deployment windows.
- Inconsistent documentation between SDK versions forced engineering teams to write internal proxy workarounds.
- Escalation tickets submitted by infrastructure leads were being routed through frontline consumer support channels, delaying critical hotfixes.
Product engineering reorganized its sprint priorities around these three root causes within forty-five days. Account retention across the affected customer tier stabilized, and expansion conversations resumed. The company achieved this recovery not by celebrating high survey completion metrics, but by replacing superficial form submissions with detailed diagnostic evidence.
What Good Looks Like: Measuring Cognitive Effort and Decision Utility
Evaluating customer research requires replacing completion rate with metrics that assess cognitive effort, substantive variety, and decision utility. High-performing enterprise research teams audit paradata for response latencies, inspect semantic diversity in open verbatims, and balance structured survey screening with voice-based customer conversations. This operational shift ensures strategic product decisions rest on genuine customer reasoning rather than unreflective compliance.
To protect strategic decisions from satisficing, research leaders must establish data hygiene standards that measure what happens between the first question and the last:
- Paradata latency tracking: Measure response time per item rather than just total survey duration. Flag responses completed in less than 40% of the median reading threshold as probable satisficing or speeder activity.
- Substantive verbatim evaluation: In surveys retaining open text, measure semantic variety and contextual relevance. Discard verbatims consisting of non-answers, single adjectives, or repetitive phrases.
- Internal consistency checking: Embed paired items with inverted valence across distinct survey blocks. When a respondent strongly agrees that a workflow is intuitive and later indicates that the same workflow causes continuous delay, flag the record for exclusion.
For complex B2B discovery, structured web forms reach a hard methodological ceiling. When a study demands trade-off rationales, organizational context, and emotional nuance, enterprise teams turn to voice-led primary research. Pulse conducts conversational, AI-led customer interviews that probe beneath surface answers without requiring manual researcher moderation for every session. Rather than forcing a buyer into a rigid 1-to-5 radio button, the system follows up on unexpected statements, asks for specific examples, and clarifies ambiguous phrases.
| Evaluation Dimension | Traditional Web Surveys | AI-Moderated Voice Interviews |
|---|---|---|
| Response Depth and Reasoning | Constrained to predetermined multiple-choice categories or brief open-ended text fields. | Captures spoken natural language; probes specific statements to surface underlying rationale, constraints, and workflow context. |
| Vulnerability to Satisficing | High; respondents can complete the entire instrument while exerting minimal cognitive effort. | Low; conversational voice interaction requires active listening and spontaneous verbal articulation. |
| Real-Time Clarification | None; ambiguous answers or contradictory selections are permanently recorded as submitted. | Active; the moderation layer detects non-sequiturs or vague responses and asks focused follow-up questions. |
| Data Quality vs. Scale Trade-off | High volume at lower cost, but completion rate is often decoupled from answer validity. | Delivers qualitative rigor and structured transcripts across dozens of participants simultaneously. |
| Appropriate Research Stage | Confirmatory tracking, baseline demographic indexing, and broad metric validation with verified populations. | Exploratory discovery, message testing, buyer decision mapping, and uncovering the drivers behind metric anomalies. |
When presenting findings to executive leadership, reframe the definition of research success. Replace the metric of raw completion percentage with clean data yield: the proportion of responses that pass rigorous latency checks, demonstrate cognitive effort, and provide verifiable rationale. An enterprise decision involving pricing, product positioning, or customer retention requires evidence that reflects genuine customer reality rather than the shortest path to a survey incentive.
Frequently Asked Questions
What is considered an acceptable survey completion rate for enterprise B2B audiences?
For internal customer lists, completion rates between 60% and 75% often indicate a healthy balance of depth and accessibility. Rates above 90% on instruments longer than five minutes should prompt audits for straightlining, speeders, and satisficing, particularly when nonprobability panels or financial incentives are involved.
How can researchers detect satisficing and straightlining in completed datasets?
Researchers detect satisficing by analyzing paradata alongside response patterns. Key diagnostic techniques include calculating page-level completion latencies, identifying zero-variance responses across matrix questions, evaluating semantic depth in open verbatims, and testing correlation between survey speed and straightline behaviors across demographic cohorts.
When does a low completion rate actually indicate a flawed survey design rather than rigorous questions?
A low completion rate indicates poor design when drop-offs concentrate on specific technical defects, such as broken mobile layouts, confusing grid interfaces, repetitive screeners, or ambiguous corporate jargon. If respondents drop out because the interface is frustrating rather than cognitively engaging, the instrument requires structural editing.
How do conversational interviews solve the depth problem inherent in traditional surveys?
Conversational interviews eliminate the depth limitations of traditional surveys by introducing dynamic follow-up probing. Instead of forcing respondents to select fixed categorical choices, conversational platforms ask participants to clarify ambiguous statements, provide recent operational examples, and explain the specific organizational context behind their business evaluations.
Explore how enterprise research teams use Pulse to run conversational customer interviews at scale, moving past superficial survey completion metrics to collect research-grade insights.